HP ProLiant DL980 G7 Server User Manual
Page 50
1.
In the first field in the Specify Data Report file section, click the drop-down menu (
) button
on the right to list the available CSV data collection log files, and select the file you want to
view. To view a report based on the most recently-collected data, select the most recent log
file, as denoted by the file name.
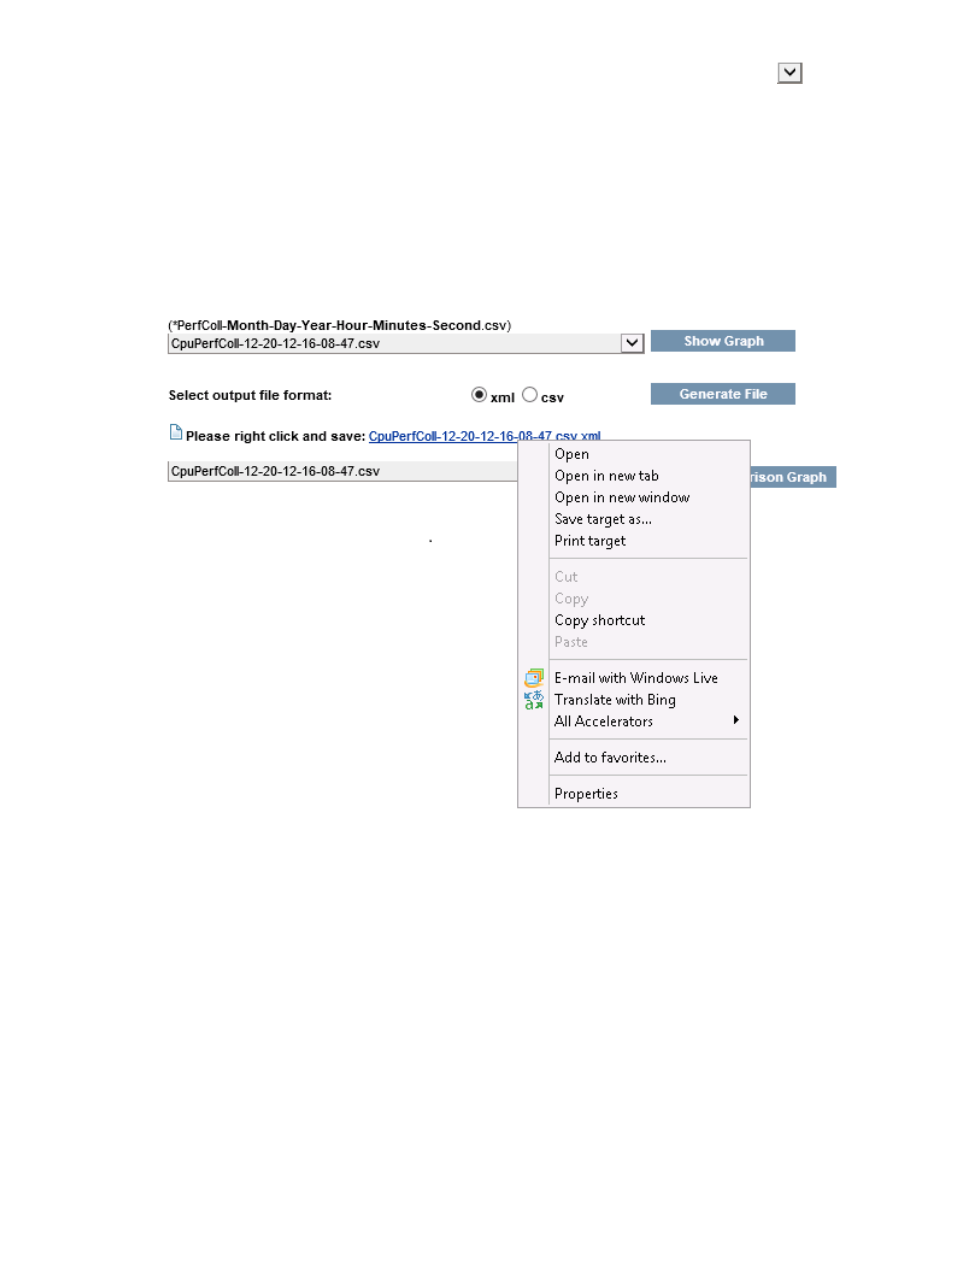
2.
If you want to export this file, select the desired export file format (XML or CSV) and click
Generate File.
Right click the file name to open or save the file, as shown in
. If you
choose to generate an XML file, you can open the file in your browser. To export the file to a
specific destination, select Save target as... and indicate the location.
Figure 44 Generate or export file
3.
If you want to view a graph of the data in the selected file, click Show Graph.
4.
On the right side of the graph, select the counters you want included or excluded in the graph
(for convenience, use the Select/Unselect All check box to select or exclude all counters listed).
You can repeat this step to change the graph to reflect different counters. A key code is listed
to show what the colors in the graph represent.
5.
To show a specific area of the graph, select the area in the Overview graph. The selected
area will be reflected in the larger graph on the left.
6.
Click Generate File to create the report.
To compare data collection log files, follow these steps:
1.
From the upper drop-down menu, select the first CSV file to compare. In
the CpuPerfColl-12–20–12–16–08–47.csv file is selected.
2.
From the lower drop-down menu, select the second CSV file to compare. In
, the CpuPerfColl-12–20–12–16–22–42.csv file is selected.
3.
Click Show Comparison Graph. In
, graphs of both files are shown.
50
Using HP ESO