Monitoring port performance, 91 port performance graph dialog box – HP StorageWorks 2.32 Edge Switch User Manual
Page 171
Optional Features
171
— Mail List—Click to select from a list of e-mail addresses.
— From—Enter your e-mail address.
— Subject—Enter a subject for the e-mail message.
— Message—Enter content for the e-mail message.
6. Click OK to export the files and close the dialog box.
7. Click OK at the confirmation window.
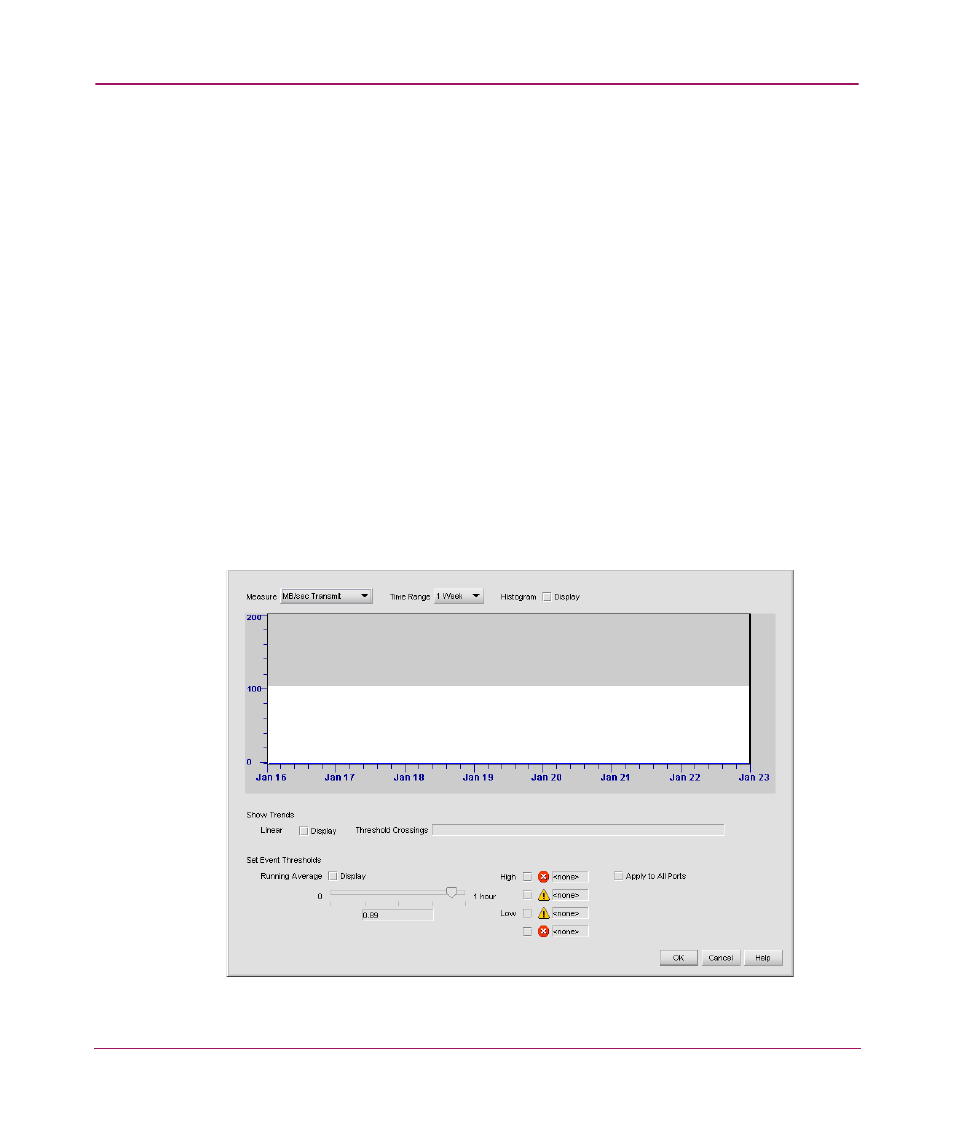
Monitoring Port Performance
You can monitor the performance of individual switch ports in the SAN through a
port performance graph. The Performance Graph displays the performance of the
switch and the devices connected to it. It also displays information about transmit
and receive performance.
1. Right-click a switch icon and choose Performance Graphs. The
Performance Graph displays, as shown in
on page 168.
2. Highlight a port row and click History/Events or double-click a port row.
The Port Performance Graph displays, as shown in
.
Figure 91: Port Performance Graph dialog box