Workload and traffic statistics, Viewing disk drive workload statistics – HP XP Auto LUN Software User Manual
Page 46
46
Auto LUN/Performance Control Base Monitor for the XP1024/XP128
Workload and traffic statistics
Collecting workload and traffic statistics about disk drives, ports, and LU paths
To obtain usage statistics about workloads, port traffic, LU path traffic, and traffic between host bus
adapters and ports, complete the following instructions to start monitoring the disk array:
1.
In the Auto LUN pane, click Monitoring Options. The Monitoring Options pane appears.
2.
Under Short range monitoring S/W, click ON for the Current Status option.
3.
Use the two lists in Gathering Time to specify the time when the disk array collects statistics.
4.
Click Apply. Auto LUN starts monitoring the disk array.
To stop monitoring the disk array, complete the following instructions. If you stop monitoring, Auto LUN
stops collecting statistics.
1.
In the Auto LUN pane, click Monitoring Options. The Monitoring Options pane appears.
2.
Under Short range monitoring S/W, click OFF for the Current Status option.
3.
Click Apply.
Viewing disk drive workload statistics
Use the LDEV tab of the Auto LUN pane to check workloads on physical disk drives (parity groups) or
logical volumes. The pane displays the following information:
•
Number of I/O requests issued to parity groups and logical volumes
•
Amount of data transferred to parity groups and logical volumes
•
Read hit rate
•
Write hit rate
•
Number of data transfers between parity groups (or logical volumes) and cache memory
1.
In the Auto LUN pane, click LDEV. The LDEV tree displays a list of parity groups.
2.
In the list on the right, click IOPS to specify I/Os per second, or click MB/s to specify megabytes
transferred per second.
3.
In the LDEV tree, do one of the following:
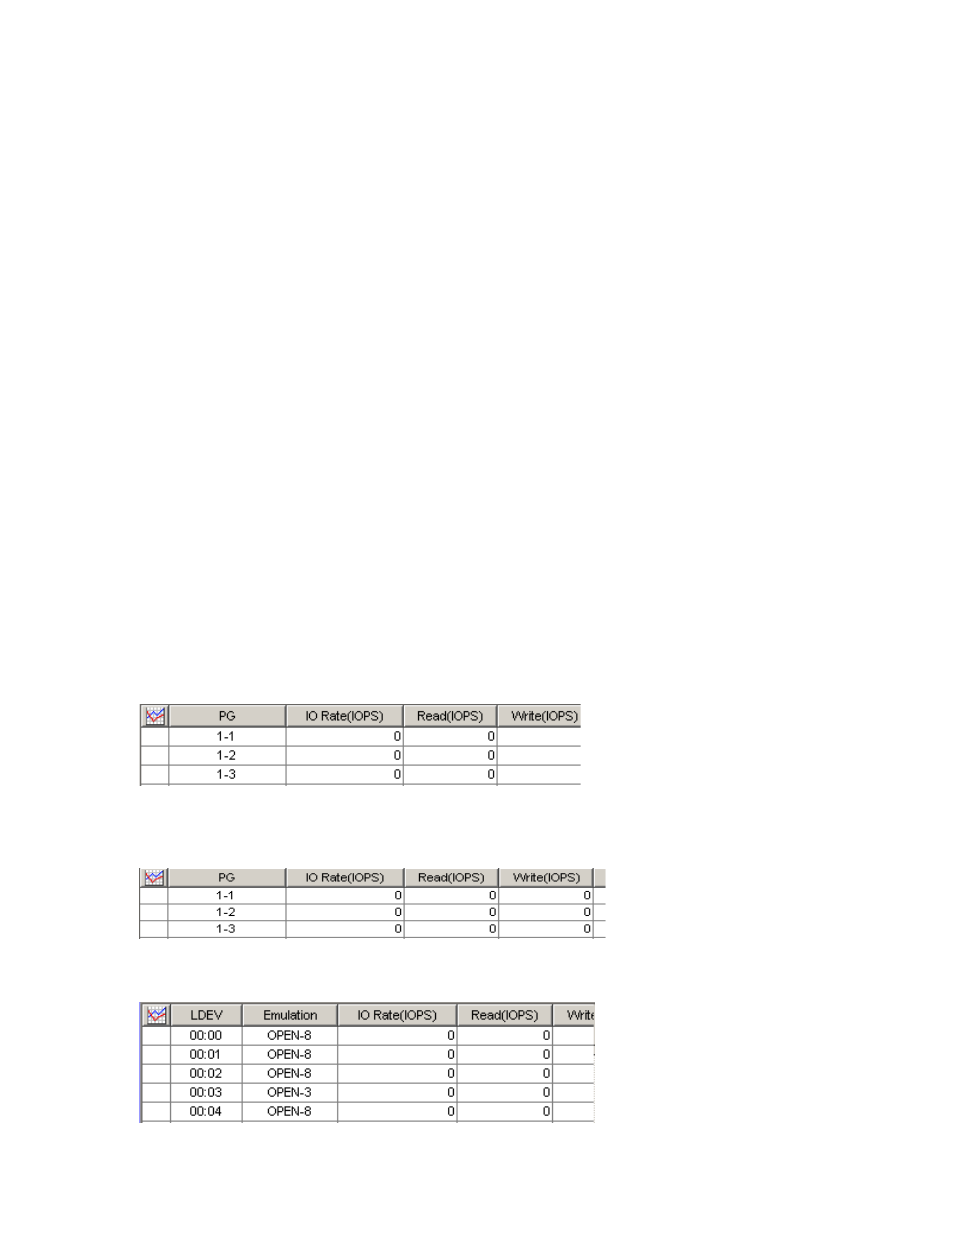
• To check workload statistics for all parity groups, click the folder containing the parity groups.
Figure 25
Workload statistics for all parity groups
• To check workload statistics for certain parity groups, click a Box folder. For example, if you click
the Box 1 folder, the table displays only parity groups that have IDs beginning with 1-.
Figure 26
Workload statistics for a specific parity group
• To check workload statistics for logical volumes in a parity group, click the parity group.
Figure 27
Workload statistics for logical volumes in a parity group