Kaman KD-5100 User Manual
Page 40
40
Analysis Results
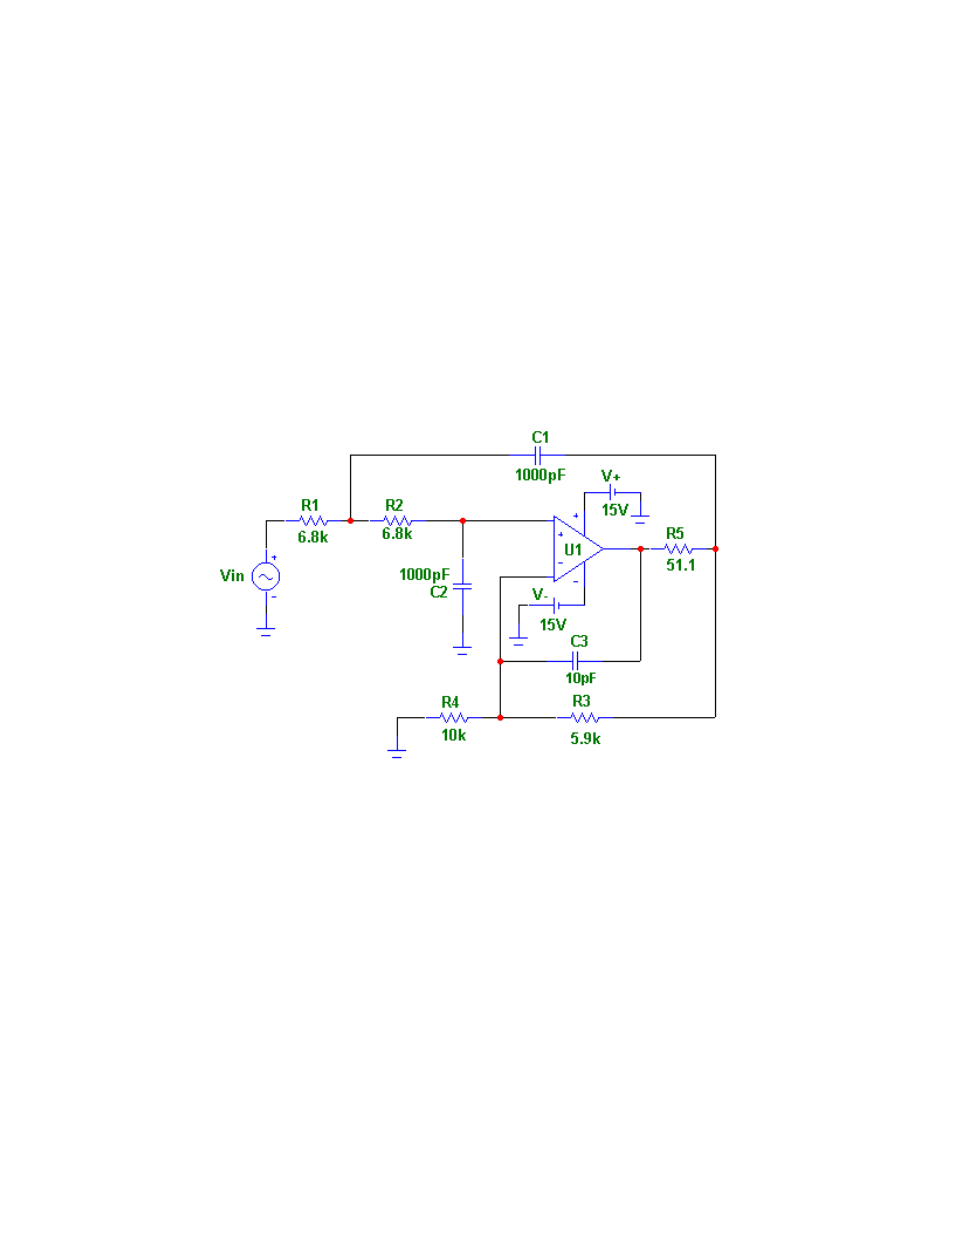
The filter was analyzed using Micro-Cap V. The plot and table below show the magnitude (dB)
and phase (degrees) output for the standard configuration in the KD5100. The –3dB point is at
about 23kHz. There is a small gain of 1.59 (about +4dB) in the circuit.
) of approximately 23 kHz.
Figure 1 – Output Filter Schematic
Analysis Results
The filter was analyzed using Micro-Cap V. The plot and table below show the magnitude (dB)
and phase (degrees) output for the standard configuration in the KD5100. The –3dB point is at
about 23kHz. There is a small gain of 1.59 (about +4dB) in the circuit.