Using vt-200 software, Description of windows application program – Dwyer VT-200 User Manual
Page 3
HOW TO DOWNLOAD CURRENT DATA FROM THE
ANEMOMETER TO THE PC USING THE RS-232C FUNC-
TION.
NOTE: The RS-232 function when downloading current data to a PC will
be automatically disabled if the REC function (storing data internally) is
continuously recording data.
1. To enable RS-232 function, press the RS-232 button (Number 1) and
the ON/OFF button at the same time.
2. Attach 9 pin male plug to anemometer and tighten down using a
standard screwdriver.
3. Attach opposite 9 pin female to COM 1 port on back of PC. (Adapter
is enclosed to accommodate 25 pin port if needed.) Tighten plug to
back
of PC with a standard screwdriver.
4. Data will be sent to RS-232C port at the rate of 15 bytes of live data
per second.
HOW TO DOWNLOAD STORED DATA TO PC USING RS-
232C FUNCTION
1. Make sure cable is attached to the meter and the PC. (See
above instructions on “Downloading current data...” if cable is
not attached.)
2. Press the DLOAD button (Number 5) to send all stored data
from memory to RS-232 port.
USING VT-200 SOFTWARE
Main Window
When the program is executed, it will automatically search for
the connected anemometer or the available serial port. If no
serial port is available, then a message of “NO COM” (No
Communication) will be displayed. Once the communication port
is setup, the main window will be displayed on the screen.
DESCRIPTION OF WINDOWS APPLICATION PROGRAM
Main Window
When the program is executed, it will automatically search for
the connected anemometer or available serial port. if no serial
port is available, then a message of “NO COMMUNICATION”
(NO COM) will be displayed . Once communication port is setup,
a main window will be displayed on the screen.
WINDOW DESCRIPTIONS
Sample:
The value under SAMPLE is the sampling time.
Temperature:
Temperature of wind or air in °C or °F.
Option:
Display option of anemometer. MAX, MIN, AVE,
2/3Vmax.
Unit:
Displays units of air velocity or air flow (m/s, ft/min,
knots, MPH, kmh, CFM, CMM.)
Value:
Displays the actual reading from the anemometer.
Range:
Displays the range of the selected unit of
measure.
Minimum:
Displays the minimum value recorded by PC.
Maximum:
Displays the maximum value recorded by PC.
Reset:
Clears both the minimum and maximum values
recorded.
Lower:
The minimum value recorded in the specified range.
Upper:
The Maximum value recorded in the specified range.
FILE
When FILE is selected from the MAIN MENU, a pull down menu
will show six options: Name, Start Recording, End Recording,
View, Plot Data from File, and Exit.
Name:
Enter file name to store data displayed in the LCD
at a specified interval.
Start Recording:
Starts recording when selected.
End Recording:
Ends recording when selected.
View:
When VIEW is selected from the FILE menu,
a view file window will be show as below.
This allows users to review ASCII data file. If a
printer is connected to the PC, users can print
content selectively.
VIEW WINDOW:
File:
This option allows user to open data file. User
will be asked to enter file name. After file
name is entered, the program will read one
block of data. The number of records in one
block depends on the memory size of the PC.
The more memory the PC has, the more
records in on block.
Blocks Read: Indicates how many blocks of records have
been read.
Records Read: Indicates how many records have been read.
Chars./Record: Indicate how many characters in one record.
Current Block: Indicates the current block number being
reviewed.
Selected: Indicates the current record number being
selected.
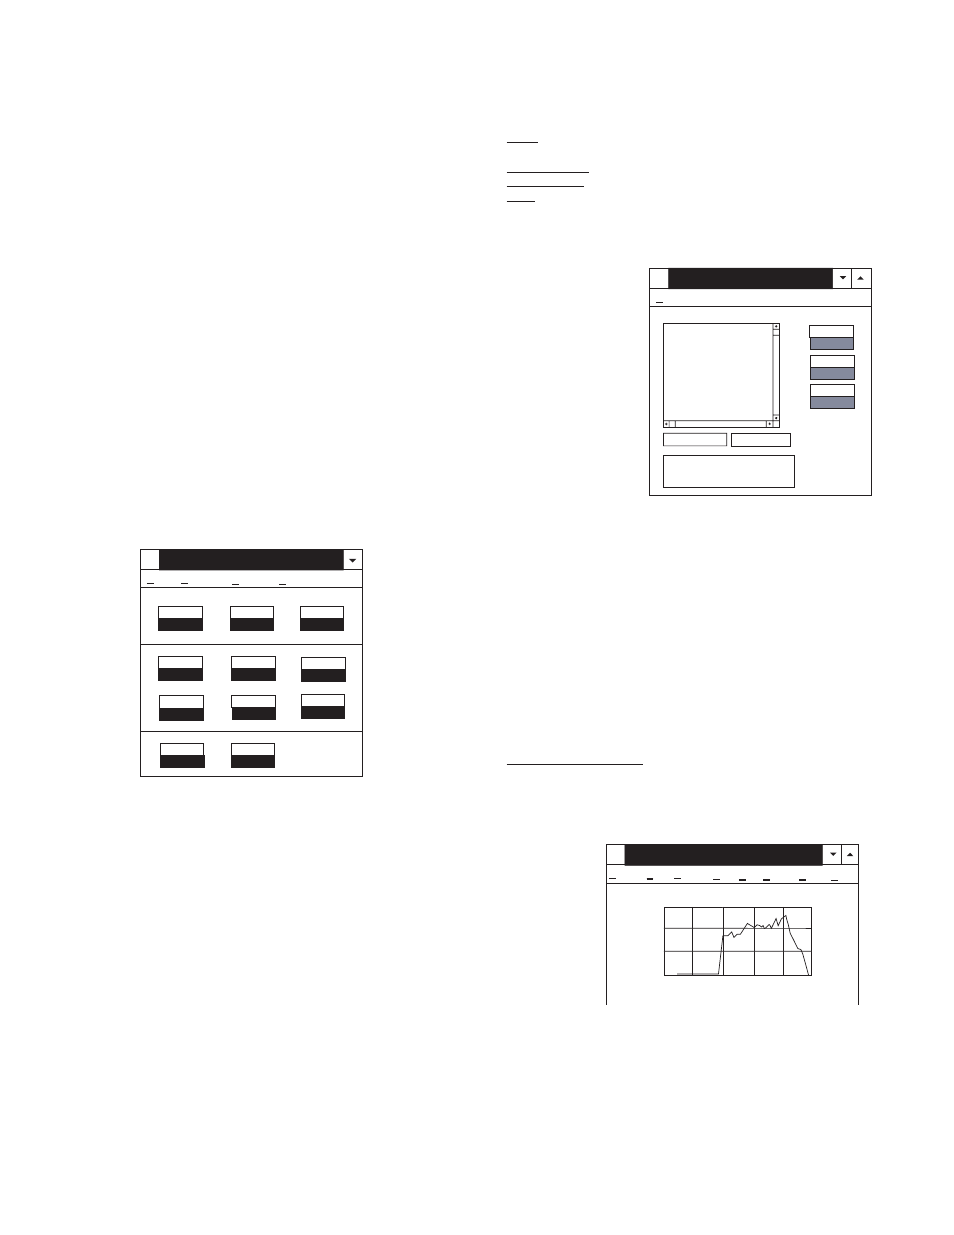
Plotting Data from File:
When the Plot Data from File option
is selected from the FILE menu, a
plot window will be displayed. The
user can plot the curve of the data
file. In the window, there are nine
options to choose from:
File: Opens the file to enable user to plot data.
Select:
Allows user to select Velocity, Temperature,
Flow or Area to be plotted.
Scale:
Allows user to set scale at Y-axis.
X Label:
User can select sequence number (1,2,3,4,...)
or time (12:00:01, 12:00:05,...) as X-axis label.
Title:
Allows user to enter a title for X-axis, Y-axis or
graph.
Grid:
Allows user to draw horizontal and vertical
grids.
Sample
1.0 SEC
Temperature
71.4
°
F
Value
00.00
Unit
ft/s
Range
45.00
Maximum
00.00
Minimum
00.00
Upper
Option
Normal
Reset
Lower
Flow Anemometer
_
File
Display
Option
Datalogger
Records Read
40
Chars/Record
71
Blocks Read
1
View
_
File
00:00:01.0, m/s, 45.00, 00.00, 21.2 C,
00:00:02.0, m/s, 45.00, 00.00, 21.2 C,
00:00:03.0, m/s, 45.00, 00.00, 21.2 C,
00:00:04.0, m/s, 45.00, 00.00, 21.2 C,
00:00:05.0, m/s, 45.00, 00.00, 21.4 C,
00:00:06.0, m/s, 45.00, 00.00, 21.2 C,
00:00:07.0, m/s, 45.00, 00.00, 21.2 C,
00:00:08.0, m/s, 45.00, 00.00, 21.2 C,
00:00:08.0, m/s, 45.00, 00.00, 21.2 C,
00:00:10.0, m/s, 45.00, 00.00, 21.2 C,
00:00:11.0, m/s, 45.00, 00.00, 21.2 C,
00:00:12.0, m/s, 45.00, 00.00, 21.2 C,
00:00:13.0, m/s, 45.00, 00.00, 21.2 C,
00:00:14.0, m/s, 45.00, 00.00, 21.2 C,
00:00:15.0, m/s, 45.00, 00.00, 21.8 C,
00:00:16.0, m/s, 45.00, 00.00, 22.2 C,
00:00:17.0, m/s, 45.00, 00.87, 22.2 C,
Current Block 1
Selected 1
00:00:01.0, m/s, 45.00, 00.00, 21.2C
Normal, Batt O.K.
Click at the list to
re-align list
Flow Anemometer - Plot Data
_
File SeLect XLabel Title Grid Zoom Clear Print
Air Speed
m/s
Time
0.0
0.5
1.0
1.5
00:00:01.0
00:00:09.0
00:00:17.0
00:00:25.0
00:00:33.0