Operation – Hach-Lange DR 3800 Additional Software LINK2SC User Manual
Page 30
18
Operation
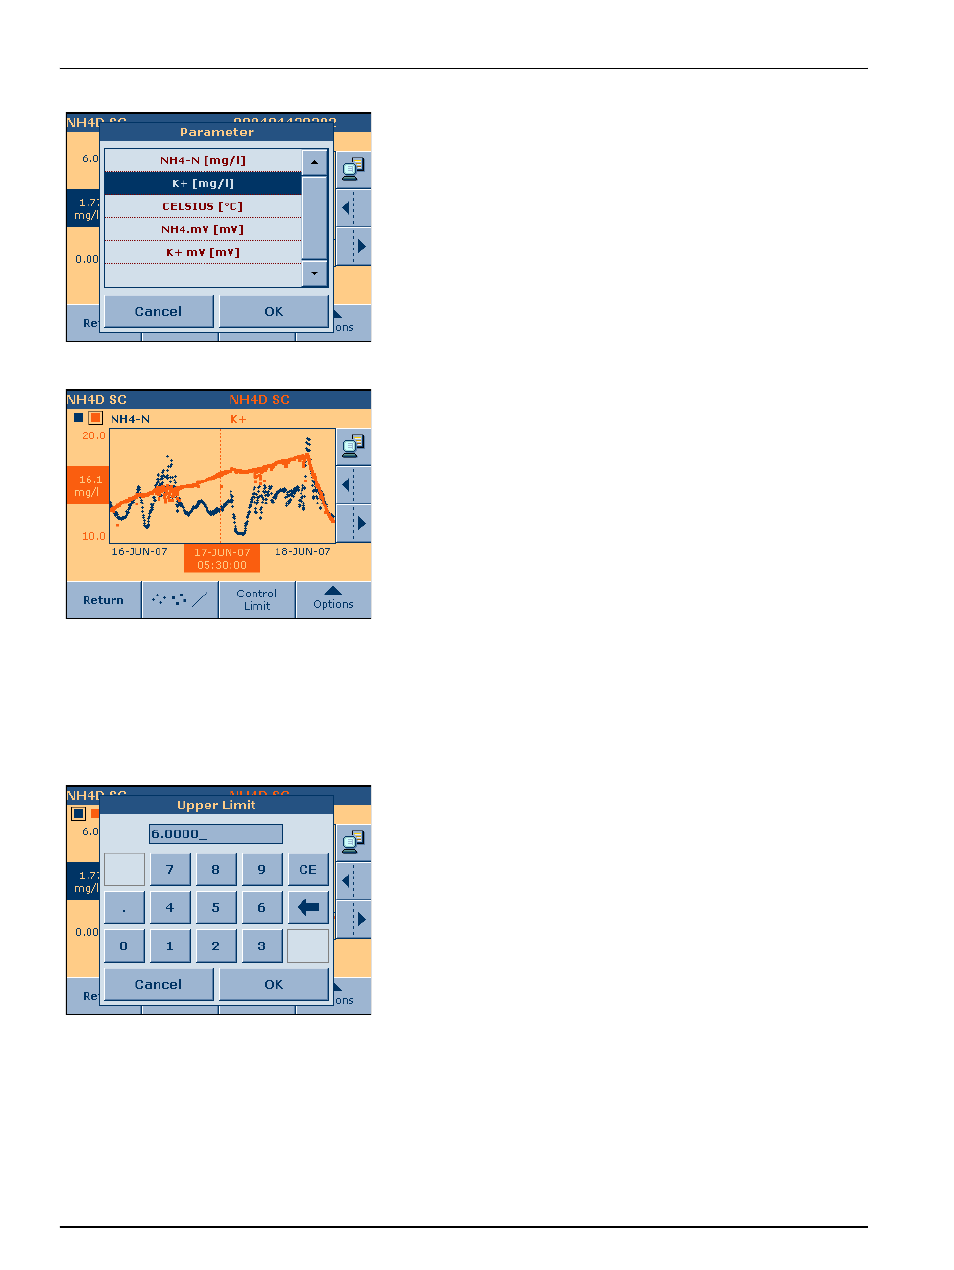
9. Confirm with OK.
The second data will be added to the display.
Note: The measured values of both parameters are displayed, but the
y-axis is a part of the active data (in this case of K
+
data).
A black and an orange box are shown in the left corner of the
display. The black box relates to the first data and the orange box
relates to the second data.
10. Press the black or orange box to switch between the graphs.
Note: The colors of the displays vary, due to the selected color palettes in
the Select Color menu.
3.3.2 Adjust the y-axis to compare the results in one diagram
To compare the results in one diagram, adjust the y-axis to the
same range for the two graphs.
Example:
1. Set the Upper Limit in the first graph (NH4-N) to 20 mg/L.
Note: Use the alphanumeric keypad to enter the number and press
OK to confirm.
- AMTAX sc (118 pages)
- PHOSPHAX sc (106 pages)
- CL17 Instruction sheet (8 pages)
- CL17 USER MANUAL (60 pages)
- CLF10 sc (382 pages)
- 9184 sc (50 pages)
- POLYMETRON 9611 sc Installation (398 pages)
- POLYMETRON 9610 sc Maintenance and Troubleshooting (286 pages)
- POLYMETRON 9611 sc USER INSTRUCTIONS: SEQUENCER LINE INSTALLATION (2 pages)
- POLYMETRON 9611 sc USER INSTRUCTIONS: SS SAMPLE CONDITIONING (4 pages)
- HACH 5500 sc Installation (408 pages)
- HACH 5500 sc Maintenance and Troubleshooting (286 pages)
- HACH 5500 sc PO43-HR Operations (390 pages)
- HACH 5500 sc PO43-LR Operations (392 pages)
- HACH 5500 sc SiO2 Installation (418 pages)
- HACH 5500 sc SiO2 Operations (394 pages)
- POLYMETRON 9610 sc SiO2 Installation (410 pages)
- POLYMETRON 9240 Basic User Manual (162 pages)
- POLYMETRON 9240 Operator Manual (144 pages)
- PHOSPHAX sigma Basic User Manual (305 pages)
- AMTAX inter2 Basic User Manual (377 pages)
- GANIMEDE P (60 pages)
- BODTrak II Basic User Manual (172 pages)
- BODTRACK II User Manual (28 pages)
- BODTRAK II: Respirometric Biochemical Oxygen Demand (BOD) (46 pages)
- SPECTRO COLOR d-8 (29 pages)
- REFO 60_REFO 60D (36 pages)
- REFO 3_REFO 3D (19 pages)
- LICO 620 Basic User Manual (329 pages)
- LICO 620 User Manual (114 pages)
- SD900 (2 pages)
- LZX971 (8 pages)
- SC Sensor Plug and SC Sensor Coupling (8 pages)
- HQ Series Portable Meters (4 pages)
- LDO Sensor Replacement Kit for use with Hach HQ10 and HQ20 (43 pages)
- LDO Sensor Replacement Kit (8 pages)
- SIP 10 (273 pages)
- SC 100 (58 pages)
- SI792 E_T Quick start guide (2 pages)
- SI792(x) E HACH GLI 3700 series SI792(x) T 7MA2200 and 8398 series User Manual (116 pages)
- SI792 D Quick start guide (2 pages)
- SI792 D, SI792x D, SI792x D-FF, SI792x D-PA User Manual (98 pages)
- SI794 C and SI794 D Short instructions (2 pages)
- SI794 D tr User Manual (108 pages)
- SI792 C Quick start guide (2 pages)