User management, View menu, Numeric view – Hach-Lange ORBISPHERE KM1100 Basic User Manual User Manual
Page 14: Numeric view configuration
Once the ID and password are entered the user is allowed to perform actions according to the
"Access level" that has been attributed by the Manager:
Access level Typical rights
0
View parameters, change views
1
+ Start / Stop measurements
2
+ Calibration
3
+ Modify parameters
4
+ Modify table "User Access level" + Enable/Disable "Access right"
At startup all menus are locked and a valid ID and password combination is required to get access
beyond the standard measurement view.
User management
Select Access table from the Security menu to show the list of registered users (a maximum of
99 users allowed). They are listed by name, ID, password and access level.
Pressing on an empty line or the Add button displays a window to add a new user. User name, ID,
password (minimum 4 characters) and access level (1 to 4) are required.
Pressing on a registered user displays a window for editing or deleting that user.
View menu
Numeric view
This is the default view and shows the measurement value, sample temperature value, and a graph
showing the measurements during the set time frame. The display is refreshed after each
measurement cycle which can be configured to suit user requirements.
The K1100 and M1100 low range sensors measure dissolved oxygen up to a maximum value of
2,000 ppb. The K1100 and M1100 high range sensors measure dissolved oxygen up to a maximum
value of 40 ppm. Should the measured concentration go above the maximum value for the sensor
then the measurement cycle is increased to 60 seconds and an Out of range message will be
displayed. An arrow symbol to the right indicates if the value is increasing, decreasing, or remaining
constant.
Once the measured value falls below the maximum value, the measurement cycle returns to the pre-
defined interval.
Numeric view configuration
1. Select Configure from the View menu followed by Conf. numeric view to customize the display:
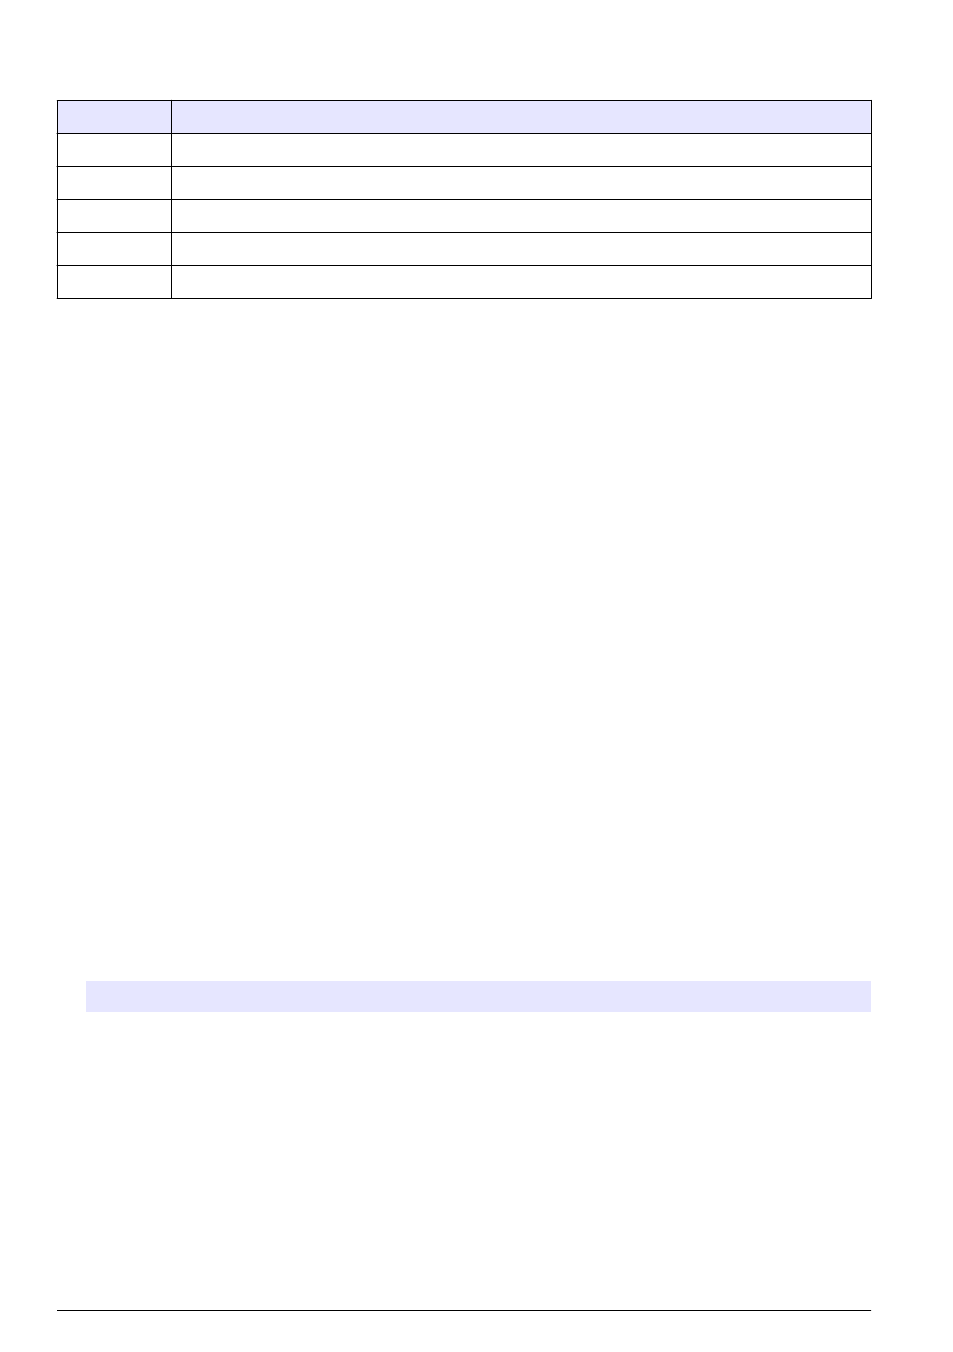
Option
Description
Display temperature
Selct Channel temperature to display the sample temperature.
Display mini graph
Check the box to display the graph.
Display time base
Check the box to display the time base.
Upper bound
Adjust graph upper limit.
Lower bound
Adjust graph lower limit.
Time base
Adjust graph time span.
Grid button
Set up the graph to display the x or y axes, grid, or alarm thresholds.
14 English