Net Optics Director xStream Pro User Manual
Page 2

© 2010 by Net Optics, Inc. Net Optics® is a registered trademark of Net Optics, Inc. Director xStream Pro
TM
is a trademark
of Net Optics, Inc.
Set the Device’s IP Address
Before you can use the Director xStream Pro
management GUI, you need to configure the unit’s
management IP address.
To set the device’s IP address:
1. Connect a PC with terminal emulation software such
as HyperTerminal to Director xStream Pro’s COM A
port (rear panel) using the supplied DB9 serial cable
and null modem (cross-over) adapter.
2. Launch terminal emulation software and set the
communication parameters to
115200 baud, 8 data
bits, no parity, 1 stop bit, no flow control.
3. Press the
Enter key until the command prompt
(cmd> appears.
4. Type
ip_address followed by the desired IP address
and netmask to change the IP address for the unit.
(cmd> ip_address 192.168.4.181 255.0.0.0
IP address has been set to 192.168.4.181.
Netmask has been set to 255.0.0.0.
(cmd>
Use the GUI
All configuration options, status, and traffic statistics are
accessed using the Director xStream Pro GUI from any
Web browser. (Firefox 3.5 or higher recommended.
Java Script must be enabled.)
To log into the Director xStream GUI:
1. Be sure the management port (top RJ45 on the rear
panel) is connected to a switch that can be reached
by your browser.
2. In the browser’s address bar, type
https:// followed
by the IP address you assigned to the device, for
example,
https://192.168.10.1. Be sure to type
https not http because a secure connection is
required. Click through any security warnings until
you get to the login screen. (The warnings do not
apply because you are connecting to a hardware
appliance, not an Internet Web site.)
3. Log in by entering the user name
admin and the
password
netoptics. The Director xStream Pro
Overview screen appears.
4. Use the command links at the top of the GUI window
to select different pages in the GUI:
• Click
Reports to view and export RMON traffic
statistics as tables and charts
• Click
Filters to set ingress and egress filters on
ProPorts, and to trigger snapshot packet captures
• Click
Snapshot to view pcap packet capture files
• Click
Topology to configure and interconnect ports
• Click
Users to administer user accounts
• Click
Settings to change system settings
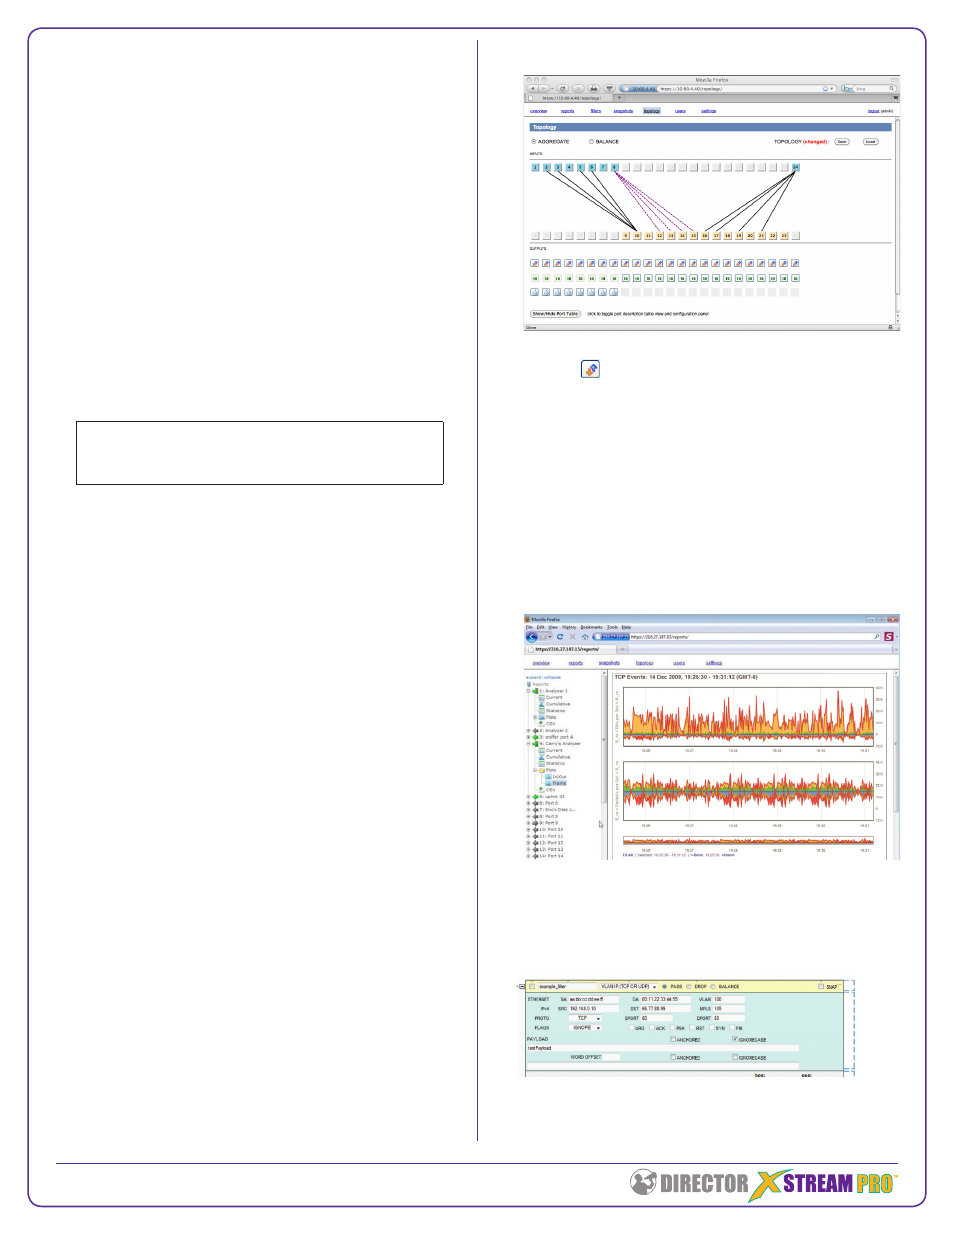
Topology screen
• Each column represents a port
• Click to change port from input (blue box) to
output (yellow box) and vice-versa
• Click
10 or 1 to change port speed—must match
SFP+ (10G) or SFP (1G) module in port (ProPorts
1 - 8 support 10G only)
• Click one input port (blue box) and one output port
(yellow box) to connect the ports
• Select
AGGREGATE to create aggregation and
regeneration connections (black lines)
• Select
BALANCE to create load balance groups
(purple dashed lines)—input ports 2, 4, 6, and 8 only
Reports screen
• Select the port and table or plot (chart) type using
the left navigation menu
Filters screen
• Select the port and click
Complex in the left
navigation menu
• Fill in the filter form as desired
Control
Specification
Status and
Counters
Activate/ Snapshot Capture
Deactivate Name Type Action Trigger
