3B Scientific Air Cushion Plate User Manual
Page 26
Physical Experiments on the Air-Cushion Table
26
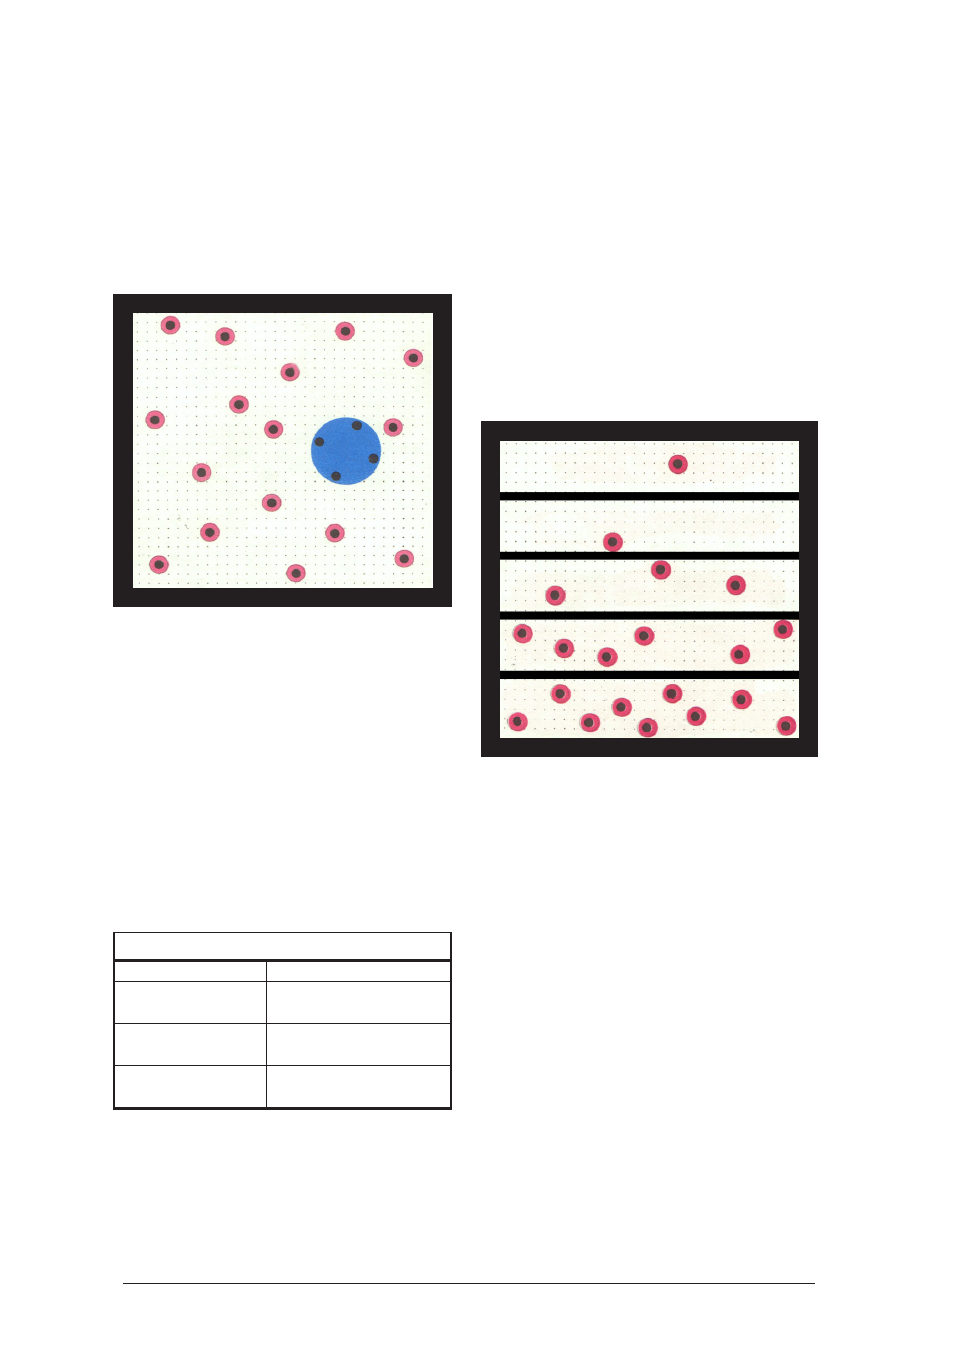
Result:
The red discs hit the blue one at irregular inter-
vals, setting it into motion. Its speed and direc-
tion of velocity change permanently, resulting in
a zigzag path.
Its average speed over time is much lower than
that of the red discs.
Interpretation:
Small particles (dust, smoke particles, water
droplets), which are visible under the microscope,
perform a Brownian motion in gases. It is caused
by the disordered motion of the gas molecules.
2.1.17
Density Distribution in a Gas in the
Gravitational Field
Components:
Air-cushion table with fan
Overhead projector
Magnetic barrier, long
2 Pieces
Magnetic barrier, short
2 Pieces
Hover disc, red
20 Pieces
Model simulation
Real Object
Model
Part of the earth’s
Experiment surface
atmosphere
of the air-cushion table
Gas molecules in the
Hover discs
earth’s atmosphere
Gravitational field
Inclination of the
experiment surface
How to proceed:
Align the air-cushion table horizontally and at-
tach the magnetic barriers on the experiment sur-
face. Arrange the hover discs near the magnetic
barriers.
Turn the fan to a medium setting. Use the adjust-
ing screw on barrier no. 4 to tilt the experiment
surface of the apparatus more and more towards
the projecting wall. Observe the changing distri-
bution of the hover discs on the experiment sur-
face.
Result:
At first, the hover discs are evenly distributed
across the entire experiment surface. As the in-
clination increases, the density of the hover discs
decreases from the bottom to the top.
Interpretation:
Where gases are contained in the gravitational
field of the earth, the density of the gas decreas-
es with increasing distance to the earth’s surface.
Note:
The experiment can also be evaluated quantita-
tively. Divide the experiment surface e.g. in 5
parallel horizontal strips of equal width. This can
be done by drawing lines on a transparency in-
serted under the air-cushion table. Turn off the
fan and count the number of discs contained in
each strip. When the average numbers of discs
contained in each strip calculated in several mea-
surements are depicted graphically as a function
of height, the slope of the graph will be nearly
exponential.
The deviations occur because each hover disc
takes up a relatively large area and the repulsive
forces have a noticeable influence on the motion
even from a distance of several centimeters.