La Crosse Technology 2800 User Manual
Page 37
P a g e
| 37
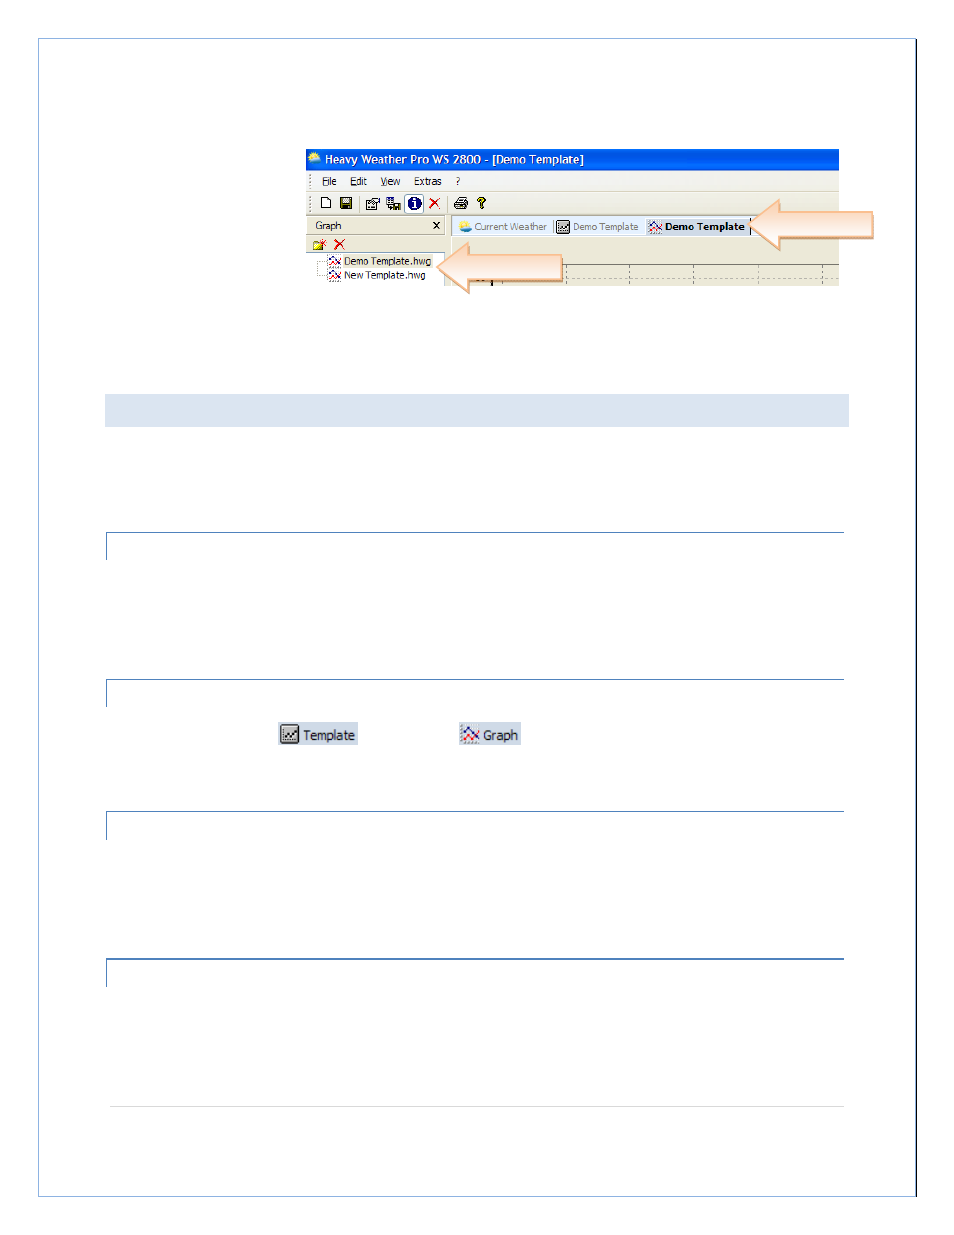
A new tab will appear next to the template tab displaying the graph created from the template. This is the
permanent copy of the
template, now referred to
as a graph.
The File Management window also switched to the Graph tab, and displays the new graph file.
WORKING WITH GRAPHS AND TEMPLATES
Now that we know how to create templates and graphs, let’s go over some of the things we can do with the data
that is displayed in our Chart window.
OPENING A GRAPH
To open a graph, select the Graph tab in the File Management window and double the filename. You can have
several graphs and templates open at one time, and each will have a tab across the top of the Chart window to
identify it.
IDENTIFYING THE CHART TYPE
Notice that template tabs
and graph tabs
each have their own unique icon to identify what
type of chart they represent.
MOVING THE CHART
You can slide the template or graph around in the chart window. To do this, click and hold the right mouse button
anywhere on the chart window. With the right mouse still held down, move the mouse and the chart will move
with it.
ZOOMING IN
To zoom in, move the mouse to a point on the chart that is above and to the left of the area you want to zoom in
on. Press and hold the left mouse button and move the mouse down and to the right, drawing a blue box around
the data you want to zoom in on.
New Graph Tab
Graph Files