1 chip manager overview, 2 temperature/register history graph, Figure 4.1 emc2101 temperature history graph – SMSC EVB-EMC2101 User Manual
Page 12: 4 software description
EVB-EMC2101 User Manual
Revision 1.5 (12-13-06)
SMSC EMC2101
12
4 Software Description
4.1
Chip Manager Overview
The Chip Manager application (ChipMan) initially displays the main Help screen, where detailed
description of the application’s features may be found. The Help screens can be displayed at any time
by selecting Help from the menu bar. ChipMan enables the user to display temperature readings, set
temperature limits and read/write configuration register values.
4.2
Temperature/Register History Graph
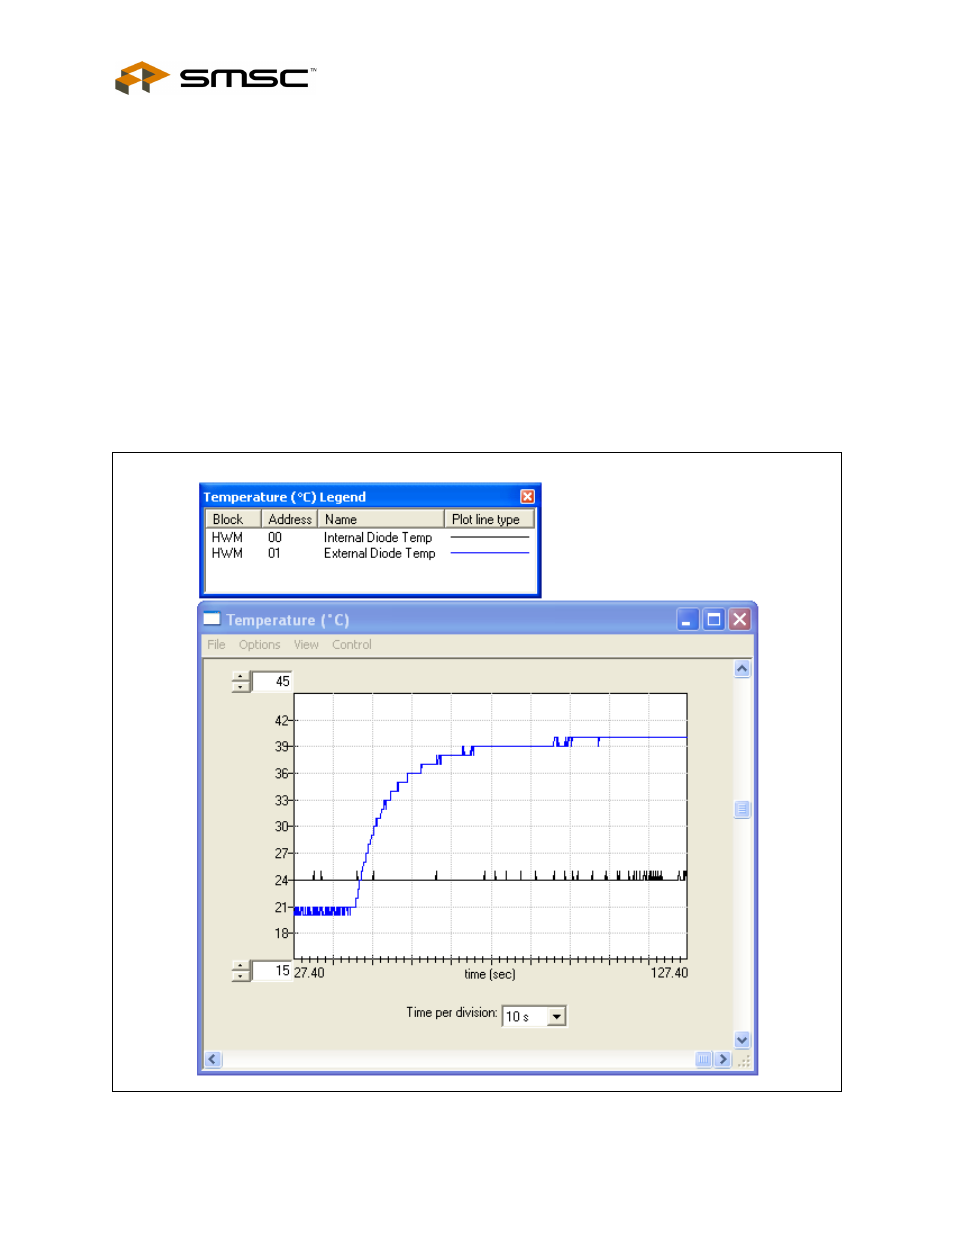
To open a Temperature or Register History Graph window, select the register or registers to plot in the
ChipMan application. then select Options -> Plot Register Data from the menu bar. Once the graph
appears, select Control -> Start to begin plotting data. The history plot continuously updates the
register data reported by the EMC2101.
below is a typical Temperature History with the
external diode starting at room temp and then being heated using the HEATER jumper (JP2).
Figure 4.1 EMC2101 Temperature History Graph