Precision Digital PD562 User Manual
Page 4
Nova Multi-Monitoring Software
Instruction Manual
4
MAIN WINDOW MENUS
The following menus are located at the top of the main
window.
• Monitoring
• Experiment
• Data Viewer
• Programming
• Graph
• Configuration
• About
Monitoring
The following options are available from this menu:
1. ON
Line to begin monitoring controllers and open
the monitoring overview window.
2. Off
Line
to close the overview window and stop
monitoring Nova controllers. This must be done
before the program can be closed.
3. Exit
to close the program once it is Off Line.
Experiment
The following options are available from this menu:
1. # Nova On/OFF to turn the monitoring of a Nova
address on or off while the program is monitoring
other Nova controllers.
Data Viewer
This menu will automatically open the Data Viewer to
examine saved data from a graph.
Programming
This menu will automatically open the Nova Program
Editor to upload, download, build, or change set point
programs for PD550 Series Programmable
Controllers.
Graph
The following options are available from this menu
when opened while viewing a detailed operation
screen:
1. # Graph On/OFF is used to setup data logging
for the Nova controller being viewed in the open
detailed operation screen. This opens a window
used to setup the data logging graph that will
appear in the detailed operation window. This
graph can be saved to the PC by clicking on the
Save Graph Data box when setting up the graph.
Configuration
The following options are available from this menu:
1. Communication to open the Communication
settings window.
About
This opens a window that
provides the product number
and version information. You
should have this information
available in the event you
must contact Precision
Digital Technical Support
DATA VIEWER
Clicking on the Data Viewer toolbar button in the main
window will launch the Data Viewer.
The Data Viewer is used to view and analyze saved data
created through the graph functions. In addition, it will
display the data points, and export the data points into
Microsoft Excel
®
.xls format.
Data Viewer Menus
The following menus are located at the top of the Data
Viewer window.
• File
• Setting
• Zoom
• Convert
File
The following options are available from this menu:
1. Open to open a saved .hdr data graph file.
2. Print
to print the displayed graph.
3. Quit
to close the data viewer program.
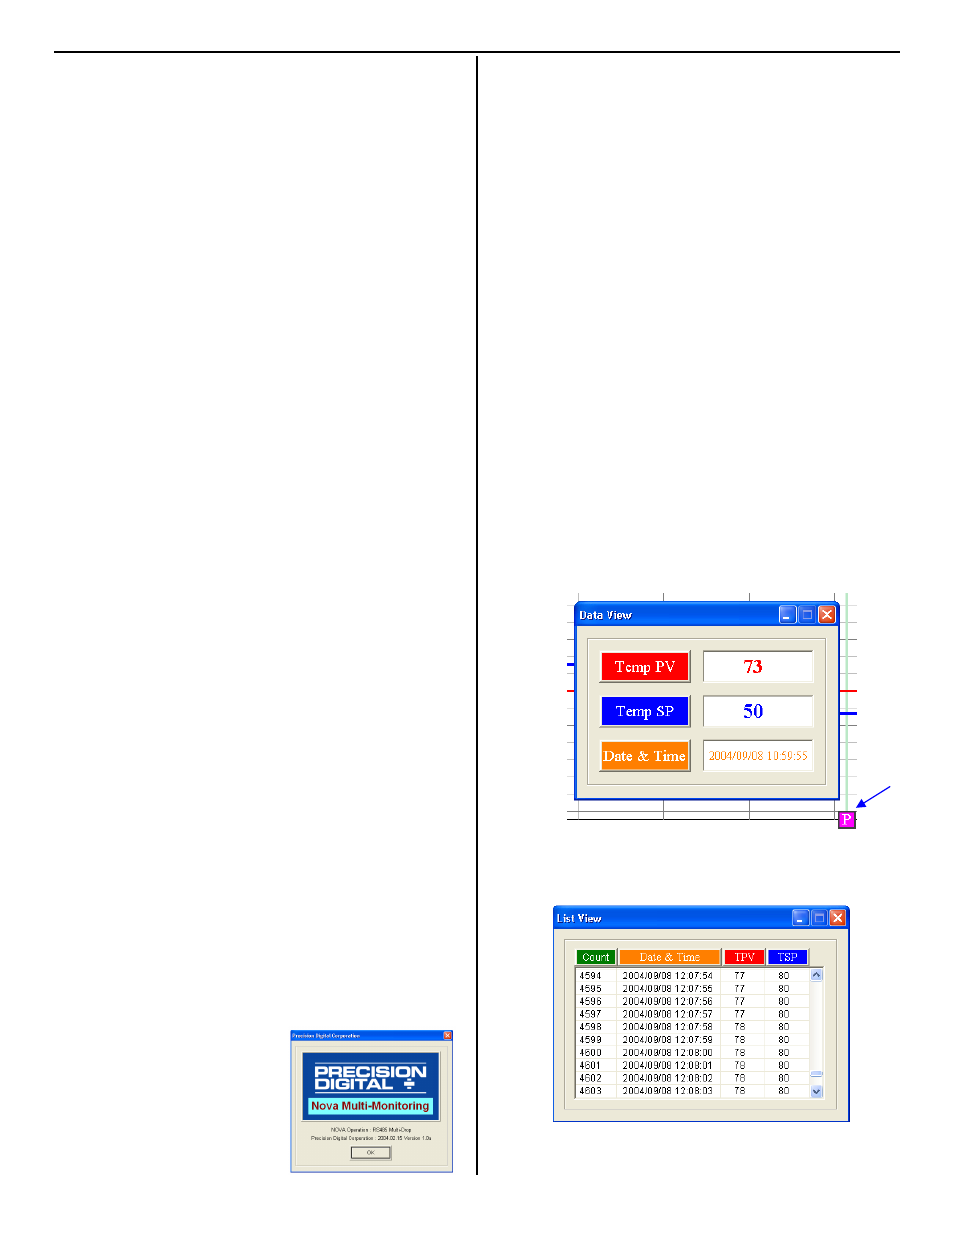
View
The following options are available from this menu:
1. Data
View
opens a window that will display the
PV, SP, date, and time of any sampling point.
Move the point selector to anywhere on the graph
to view the details of that point.
2. List View opens a window that displays all
gathered data points, the time they were
sampled, the PV, and SP.
Data Display
Point Selector