Casio fx-9750G Graphing User Manual
Page 18
142
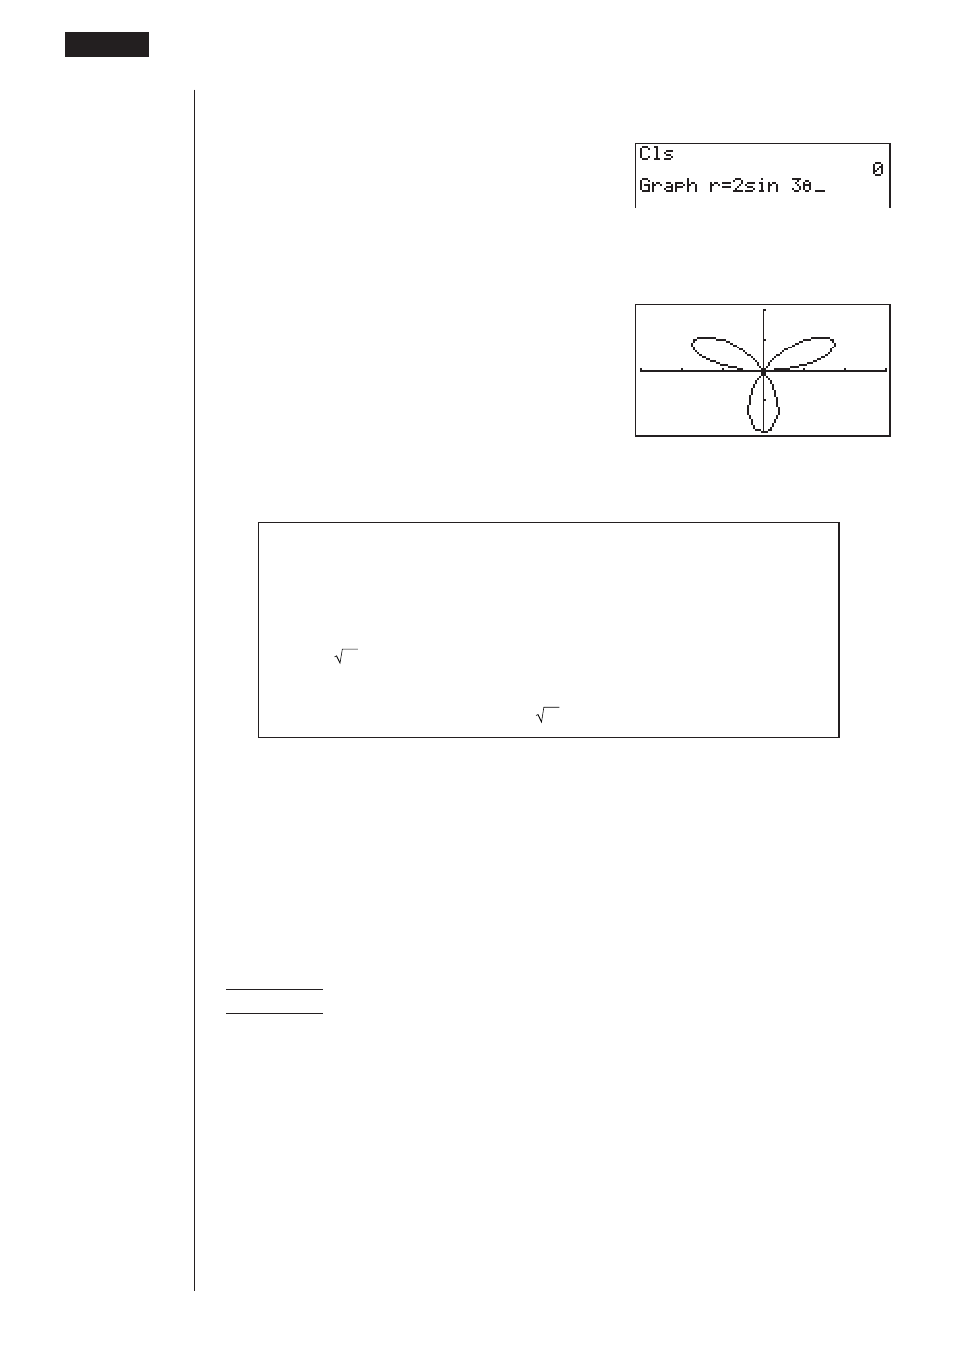
3. Input the polar coordinate expression (
r
=).
!4
(Sketch)
1
(Cls)
w
5
(GRPH)
2
(
r
=)
csdv
4. Press
w
to draw the graph.
w
• You can draw graphs of the following built-in scientific functions.
• sin
θ
• cos
θ
• tan
θ
• sin
–1
θ
• cos
–1
θ
• tan
–1
θ
• sinh
θ
• cosh
θ
• tanh
θ
• sinh
–1
θ
• cosh
–1
θ
• tanh
–1
θ
•
θ
•
θ
2
• log
θ
• ln
θ
• 10
θ
•
e
θ
•
θ
–1
•
3
θ
• View Window settings are made automatically for built-in graphs.
uuuuu
To graph parametric functions
You can graph parametric functions that can be expressed in the following format.
(X, Y) = (
f
(T),
g
(T))
Example
To graph the following parametric functions:
x
= 7 cos T – 2 cos 3.5T
y
= 7 sin T – 2 sin 3.5T
Use the following View Window parameters.
Xmin
= –20
Ymin
= –12
Xmax
= 20
Ymax
=
12
Xscale
=
5
Yscale
=
5
T,
θ
min =
0
T,
θ
max =
4
π
T,
θ
pitch =
π÷
36
8 - 5
Drawing Graphs Manually
- fx-115ES (75 pages)
- fx-115ES (54 pages)
- FX-9750GII (402 pages)
- FX-9750GII (17 pages)
- FX-9750GII (411 pages)
- FX-300MS (2 pages)
- FX-300MS (9 pages)
- DJ-120TG (67 pages)
- FX-9860G AU E (6 pages)
- FX-9860G AU E (9 pages)
- FX-CG20 (601 pages)
- FX-CG20 (18 pages)
- fx-FD10 Pro (601 pages)
- MJ-120D (75 pages)
- fx-115MS (46 pages)
- fx-115MS (39 pages)
- FX-82SOLAR (38 pages)
- fx-9750G Dual Graph (8 pages)
- fx-7400G Programming (486 pages)
- fx-9750G PLUS Getting Acquainted (39 pages)
- fx-570ES PLUS (46 pages)
- fx-991ZA PLUS (59 pages)
- fx-350TL (36 pages)
- CFX-9950GB PLUS (28 pages)
- CFX-9850GB PLUS (19 pages)
- ALGEBRA FX 1.0 PLUS Programming (603 pages)
- ALGEBRA FX2.0 Advanced Statistics INTR (596 pages)
- ALGEBRA FX2.0 Advanced Statistics DIST (67 pages)
- TE-100 (88 pages)
- 9860 (5 pages)
- EMULATOR FX-ES (18 pages)
- fx-7400G Getting Acquainted (12 pages)
- FX-912MS (19 pages)
- s-v.p.a.m. fx-300MS (40 pages)
- fx-5800P (147 pages)
- SF-4900ER (118 pages)
- FX-991WA (38 pages)
- SF-7200SY (83 pages)
- ClassPad 300 Spreadsheet Application (954 pages)
- ClassPad 300 Spreadsheet Application (965 pages)
- ClassPad 300 Spreadsheet Application (753 pages)
- ClassPad 300 PLUS (18 pages)
- ClassPad 330 V.3.03 (670 pages)
- fx-570W (43 pages)
- fx-3950P (61 pages)