Reading the display, Chapter 1: getting ready, Display panel – Casio EA-100 Getting Ready User Manual
Page 8: Display screen areas
8
Chapter 1: Getting Ready
Reading the Display
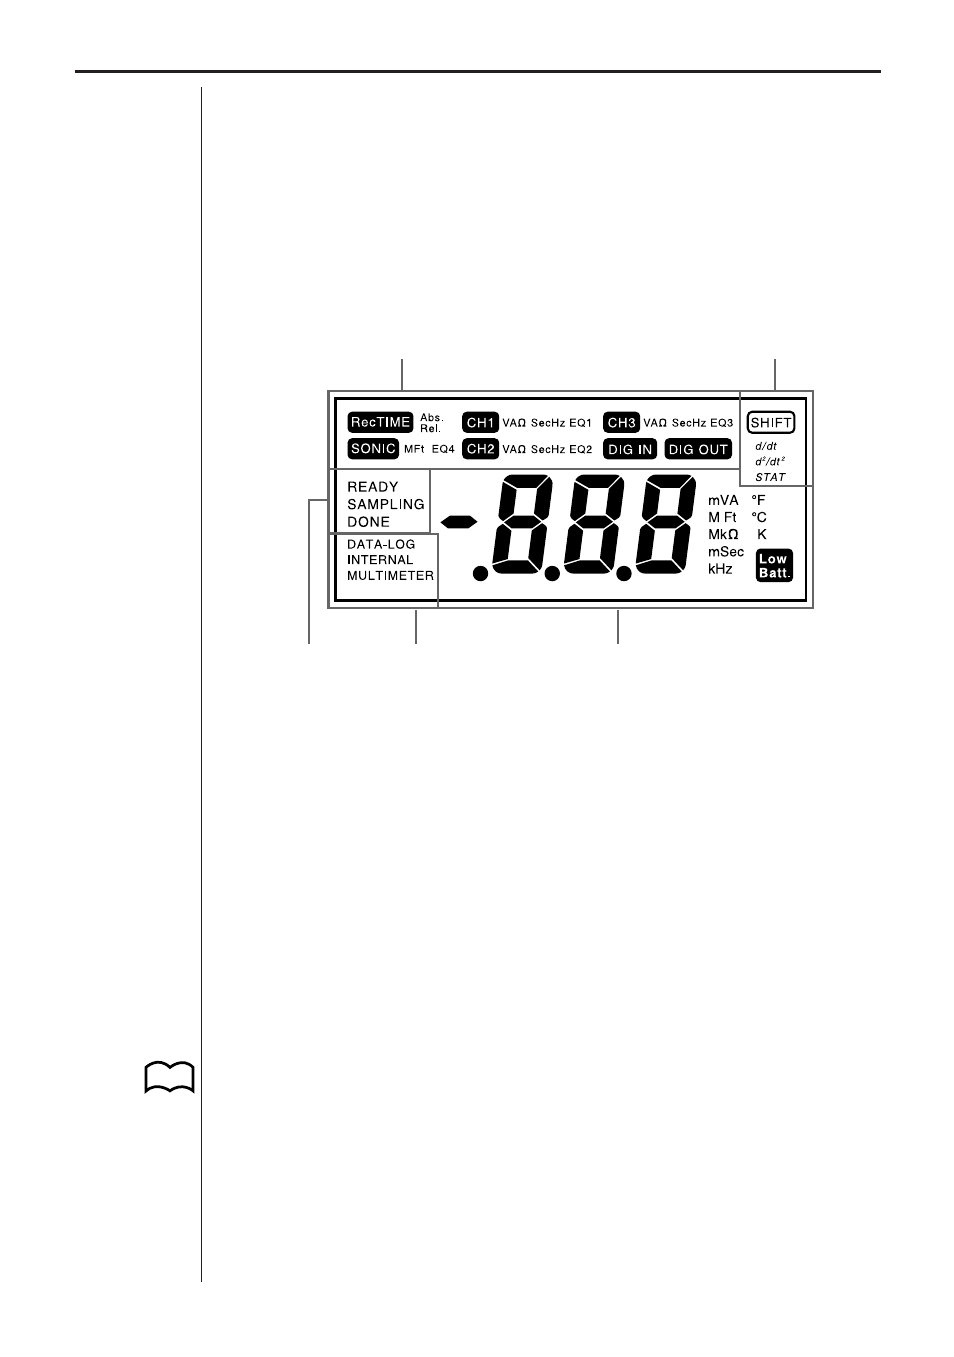
The data analyzer’s liquid crystal display (LCD) is divided among five areas,
each of which indicates the status of a particular operation.
Display Panel
The display screen shows the current operating mode, the input/output chan-
nel being used, and information about the current sampling operation.
A r e a 1
A r e a 3
A r e a 4
A r e a 5
A r e a 2
Display Screen Areas
Area 1 (Channel Area)
This area shows the active channel and the sampling unit for each channel,
and whether recorded time data is absolute or relative. Channel indicators
(CH1, CH2, CH3, SONIC, DIG IN, and DIG OUT) appear to indicate the
currently active channel. The sampling units to the right of each channel indi-
cator show the sampling unit for the probe connected to the channel. An EQ
indicator (EQ1 through EQ4) also appears when a conversion equation is
being used. The RecTIME indicator appears when time data is being re-
corded along with sampled data. “Abs.” indicates absolute time, while “Rel.”
indicates relative time.
Area 2 (Post-processing Area)
The indicators in this area (
d/dt
,
d
2
/dt
2
,
STAT
) show what type of post-process-
ing of data is being performed. SHIFT appears to indicate that the keyboard
is shifted and that the functions marked above the [MODE], [INTERNAL] and
[HALT] keys are enabled.
P.4
P.6,7