2 display – SMA WB 3000-21 User Manual
Page 11

SMA Solar Technology AG
3 Product Description
User Manual
WB3-5TL-21-BA-en-10
11
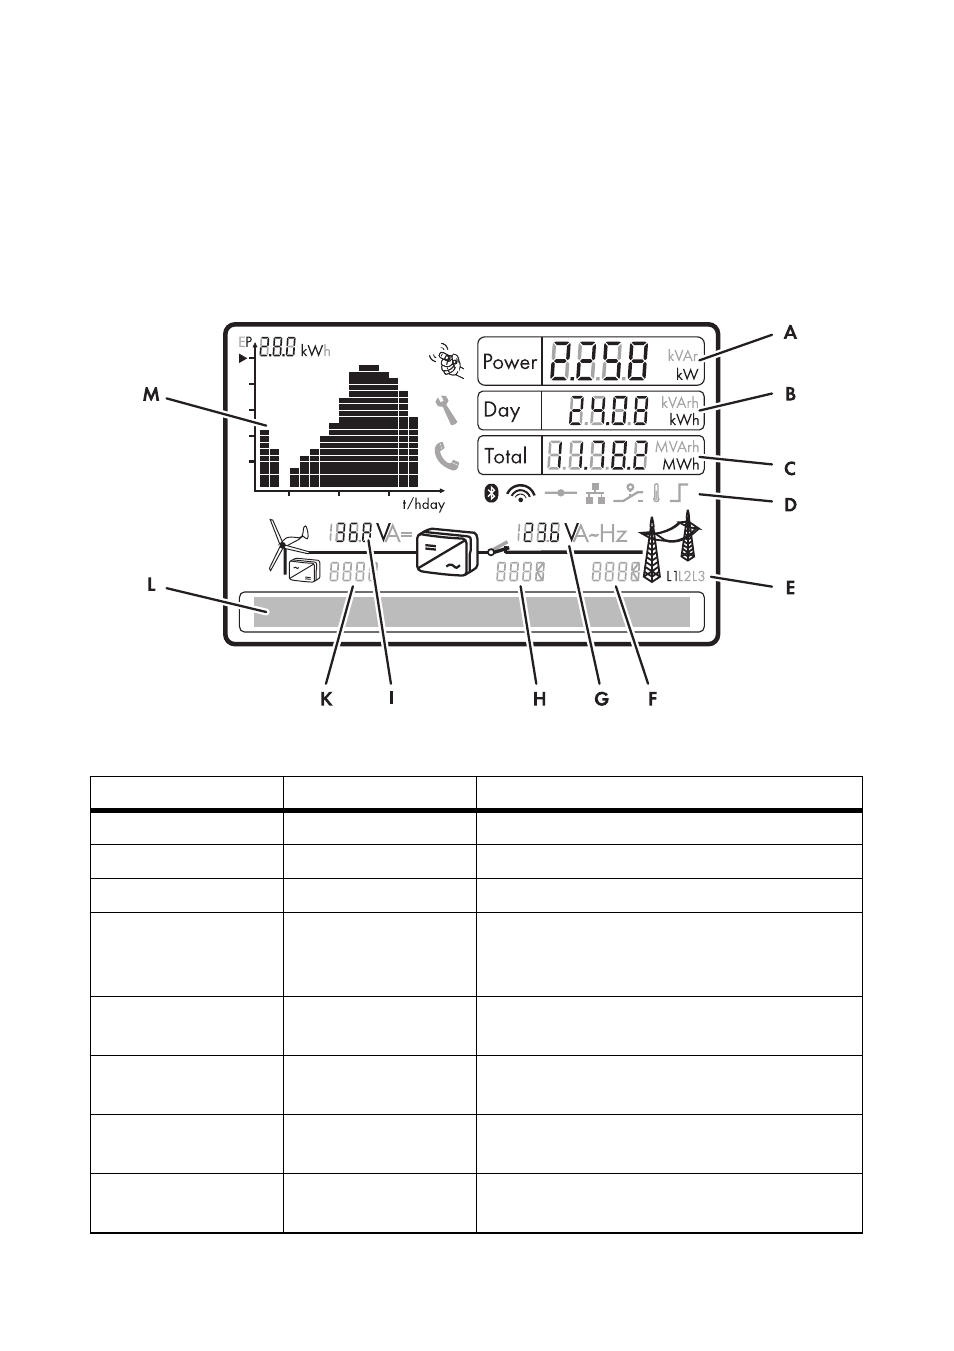
3.2 Display
The display shows the current operating data of the inverter (e.g. current power, daily energy, total
energy) as well as events or errors. The power and energy are displayed as bars in the diagram.
The display values may deviate from the actual values and must not be used for billing purposes.
The values measured by the inverter are required for the operational control and to control the current
to be fed into the electricity grid.
Figure 3: Design of the display (example)
Position
Description
Explanation
A
Power
Current power
B
Day
Daily energy
C
Total
Total amount of energy fed in until now
D
Active functions
The different symbols indicate which functions for
communication, grid management or
temperature derating are enabled or active.
E
Line conductor
Indicates which line conductor the displayed
values are assigned to
F
Event number relating
to the electricity grid
Event number of errors relating to the electricity
grid
G
Output voltage/
output current
Alternates between output voltage and output
current of a line conductor
H
Event number relating
to the inverter
Event number of errors relating to the inverter
