Frequency response curves, Obtaining copies of the calibration pack – Guralp Systems CMG-40T User Manual
Page 25
Operator's guide
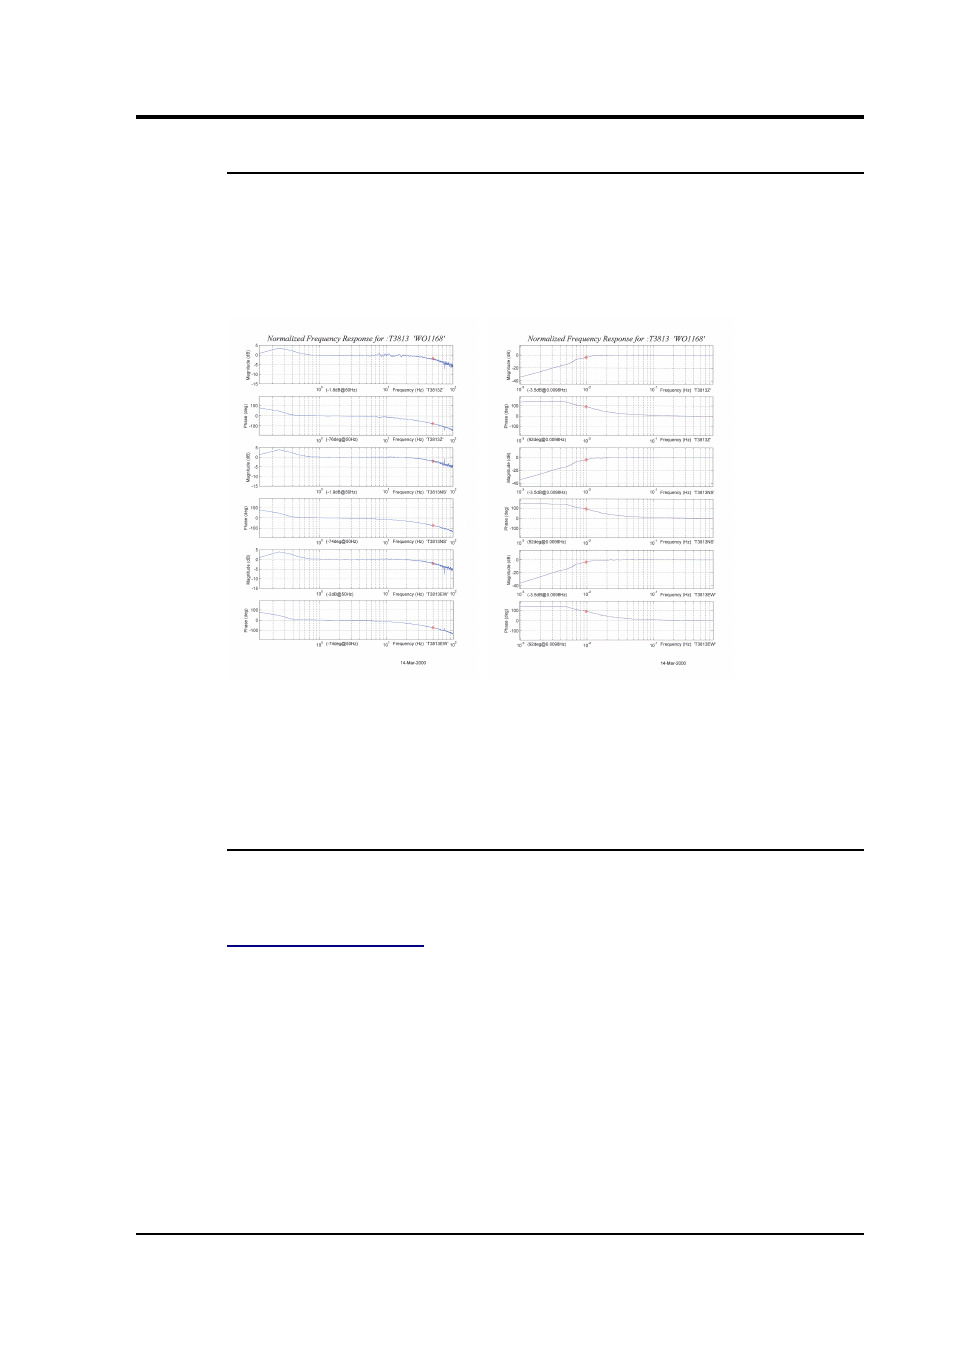
Frequency response curves
The frequency response of each component of the 40T is described in the
normalised amplitude and phase plots provided. The response is measured at
low and high frequencies in two separate experiments. Each plot marks the low-
frequency and high-frequency cutoff values (also known as –3 dB or half-power
points).
If you want to repeat the calibration to obtain more precise values at a frequency
of interest, or to check that a sensor is still functioning correctly, you can inject
calibration signals into the system using a Güralp digitizer or your own signal
generator, and record the instrument's response.
Obtaining copies of the calibration pack
Our servers keep copies of all calibration data that we send out. In the event that
the calibration information becomes separated from the instrument, you can
obtain all the information using our free e-mail service. Simply e-mail
with the serial number of the instrument in the subject
line, e.g.
From: [email protected]
Subject: T3A15
The server will reply with the calibration documentation in Word format. The
body of your e-mail will be ignored.
January 2006
25