Power savings, Year cost savings – Dell R810 User Manual
Page 27
Servers: Database consolidation on Dell PowerEdge R810 servers
27
Power savings
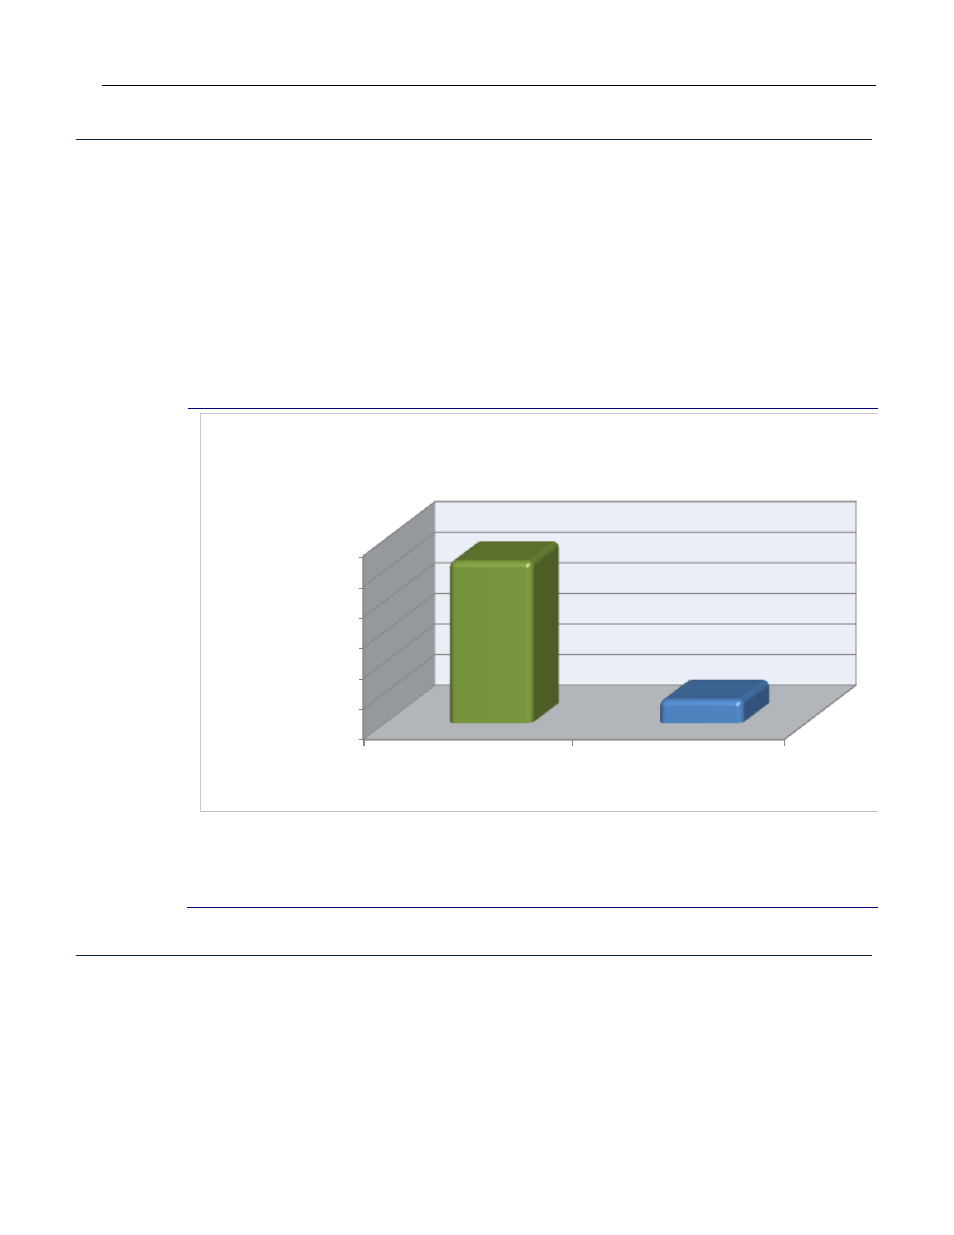
We measured power to the test servers and storage when idle and
while running the benchmark under peak load. We measured
energy usage of the HP StorageWorks MSA30 with both a full
enclosure and a half enclosure and use the full enclosure results for
this ROI analysis. We averaged the idle and peak load results to
estimate a power usage under typical load for the test
configurations. We then calculated solution totals for the Dell
PowerEdge R810 solution and the 24 HP ProLiant DL385 solutions
that we compare in this ROI analysis. Figure 11 shows our results.
0
2,000
4,000
6,000
8,000
10,000
12,000
24 HP ProLiant
DL385 solutions
1 Dell PowerEdge
R810 solution
Wa
tt
s
Typical power usage: 24 HP ProLiant DL385 solutions
vs. 1 Dell PowerEdge R810 solution
Figure 11: Estimated power usage under typical load for the single Dell PowerEdge
R810 solution and 24 HP ProLiant DL385 solutions. Typical power is the average of
idle power and power under load. Lower results are better.
3-year cost savings
We estimated acquisition costs and ongoing operating costs for the
two solutions over a 3-year period. In this analysis, the Dell
PowerEdge R810 solution delivered payback within the first year,
offsetting its acquisition costs by major savings in operating costs
and delivered a significant ROI over 3 years.