Display graph – CITIZEN MG0000 User Manual
Page 113
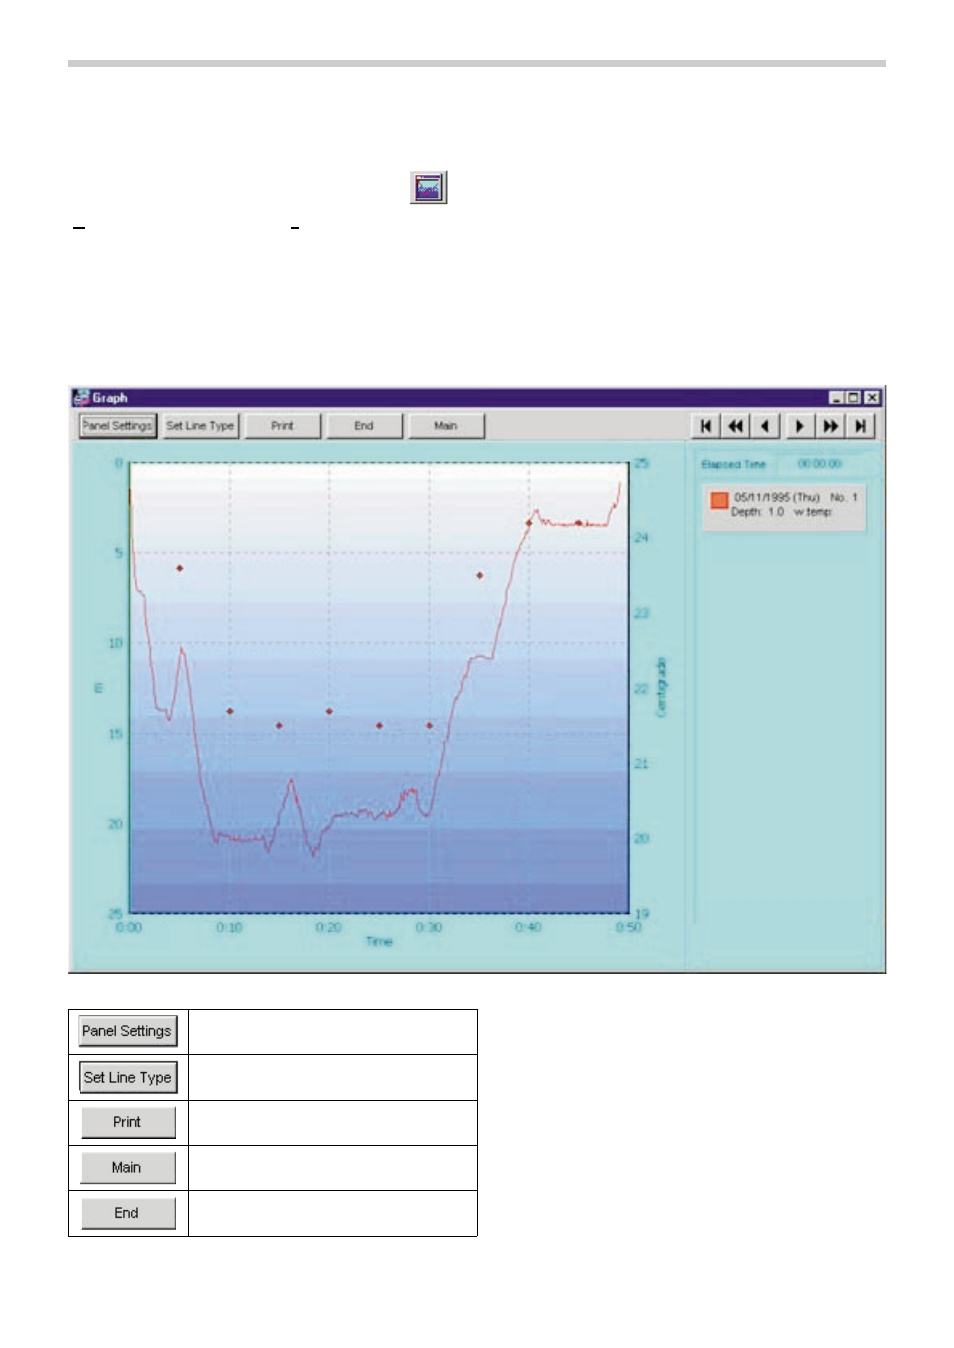
8. Display Graph
A graph is displayed of the diving data displayed in the
New Log is not displayed in the graph.
The
button of the
(G)] is selected from the [Display (L)] menu.
When diving list data is selected from the
is displayed that corresponds to the selected log. In the case of selecting multiple sets of diving data, the graphs of a
maximum of 8 data sets can be displayed superimposed on each other.
The graph display does not change when more than 8 data sets have been selected. The graph cursor can be moved by
clicking the mouse on the graph cursor MOVE button. The data at the location of the cursor is displayed in the legend.
42
Ends the
Displays the
window.
Prints out the graph as it appears on the
screen.
Sets the display of the lines to be
displayed on the graph.
Sets the background display and other
graph settings.