Conductivity versus temperature chart – Hanna Instruments HI 8033 User Manual
Page 5
9
8
The conductivity of an aqueous solution is the measure of its ability to
carry an electrical current by means of ionic motion.
The conductivity invariably increases with increasing temperature.
It is affected by the type and number of ions in the solution and by
the viscosity of the solution itself. Both parameters are temperature
dependent. The dependency of conductivity on temperature is ex-
pressed as a relative change per degree Celsius at a particular
temperature, commonly as percent per °C.
For manual temperature compensation, refer to the following chart:
°C
°F
HI 7030
HI 7031
HI 7033
HI 7034
HI 7035
HI 7039
HI 8030
HI 8031
HI 8033
HI 8034
HI 8035
HI 8039
(µS/cm)
(µS/cm)
(µS/cm)
(µS/cm)
(µS/cm)
(µS/cm)
0
32
7150
7 7 6
64
48300
65400
2760
5
41
8220
8 9 6
65
53500
74100
3180
10
50
9330
1020
67
59600
83200
3615
15
59
10480
1147
68
65400
92500
4063
16 60.8
10720
1173
70
67200
94400
4155
17 62.6
10950
1199
71
68500
96300
4245
18 64.4
11190
1225
73
69800
98200
4337
19 66.2
11430
1251
74
71300
100200
4429
20
68
11670
1278
76
72400
102100
4523
21 69.8
11910
1305
78
74000
104000
4617
22 71.6
12150
1332
79
75200
105900
4711
23 73.4
12390
1359
81
76500
107900
4805
24 75.2
12640
1386
82
78300
109800
4902
25
77
12880
1413
84
80000
111800
5000
26 78.8
13130
1440
86
81300
113800
5096
27 80.6
13370
1467
87
83000
115700
5190
28 82.4
13620
1494
89
84900
117700
5286
29 84.2
13870
1521
90
86300
119700
5383
30
86
14120
1548
92
88200
121800
5479
31 87.8
14370
1575
94
90000
123900
5575
For instance, the conductivity values of the calibration solutions at
25°C are 12880 µS/cm, 1413 µS/cm or 5000 µS/cm when using
HI 7030, HI 7031 or HI 7039, respectively.
At 20°C, the values are 11670 µS/cm, 1278 µS/cm or
4523 µS/cm, respectively.
With the solutions at 30°C, the values are 14120 µS/cm, 1548 µS/cm
or 5479 µS/cm, respectively.
CONDUCTIVITY VERSUS
TEMPERATURE CHART
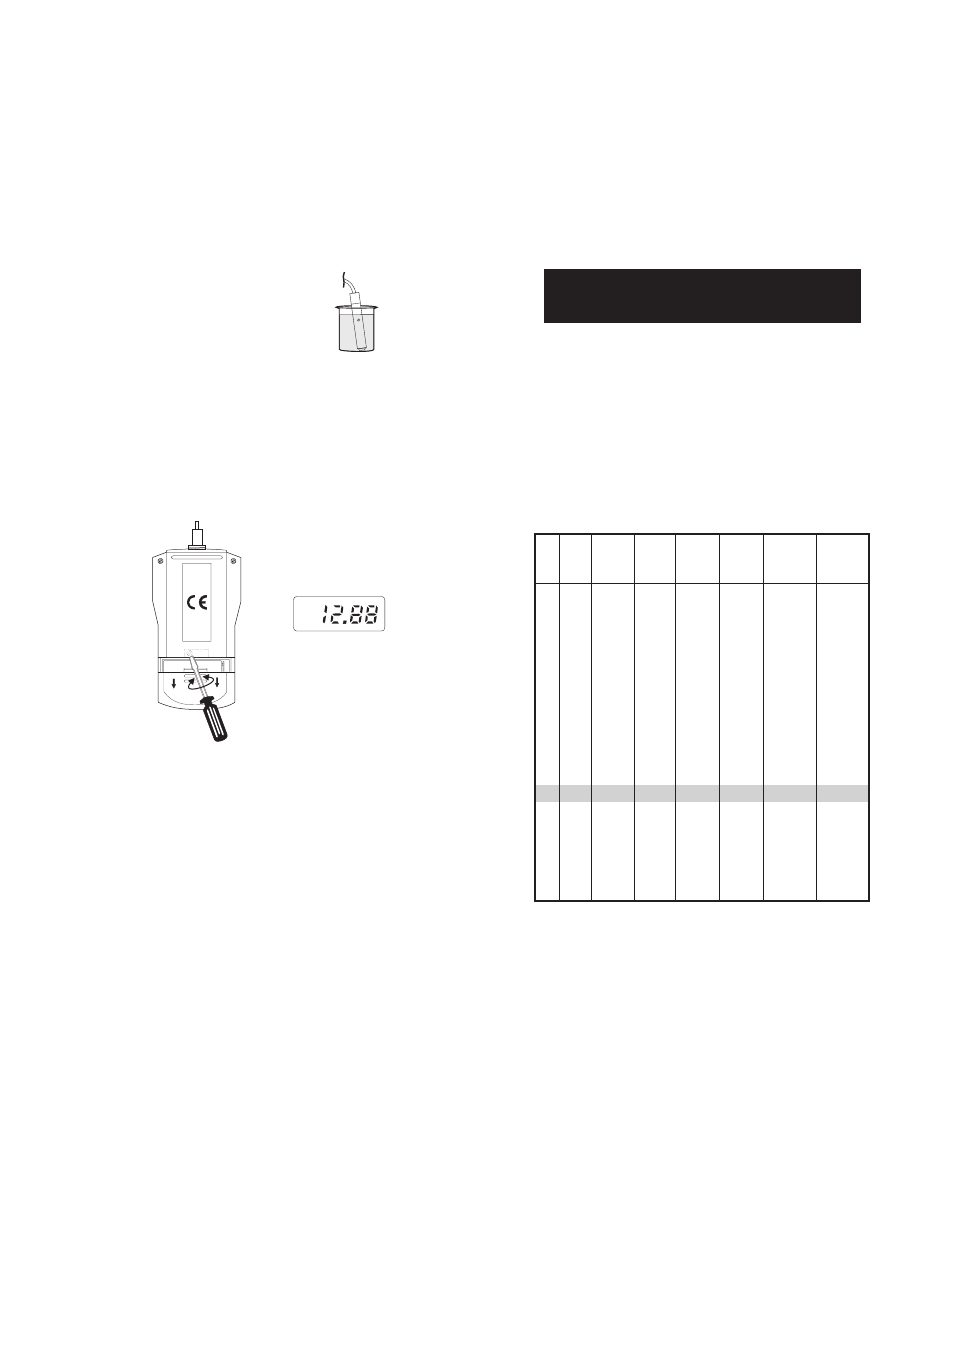
9 VOLT BATTERY
mS
• Immerse the conductivity probe in the
solution and wait a couple of minutes for
thermal equilibrium to be reached.
• Tap the probe on the bottom, then shake
it while rotating to make sure no air
bubbles remain trapped in the sleeve.
• Switch the instrument on by pressing ON/OFF, and select the
19.99 mS/cm range by pressing the corresponding range key.
• With the supplied screwdriver, adjust the calibration trimmer in
the battery compartment until the display shows "12.88 mS", i.e.
the solution conductivity value at 25°C. All subsequent measure-
ments will be compensated to 25°C (77°F).
• If you prefer to standardize the temperature compensation to
20°C (68°F), adjust the trimmer to read "11.67 mS" (see
"Conductivity vs. temperature chart "), and all subsequent mea-
surements will be compensated to 20°C.
• The calibration is now complete and the meter is ready for use.