VICI Dynacalibrator 345 User Manual
Page 23
19
Basic Operation
select from the installed devices, and the graph will update with the historical
data of the selected device. Use your finger to scroll from right to left along
the line. As the cursor moves, the exact measurements of each point will be
displayed, along with the date and time of the recording of that data point.
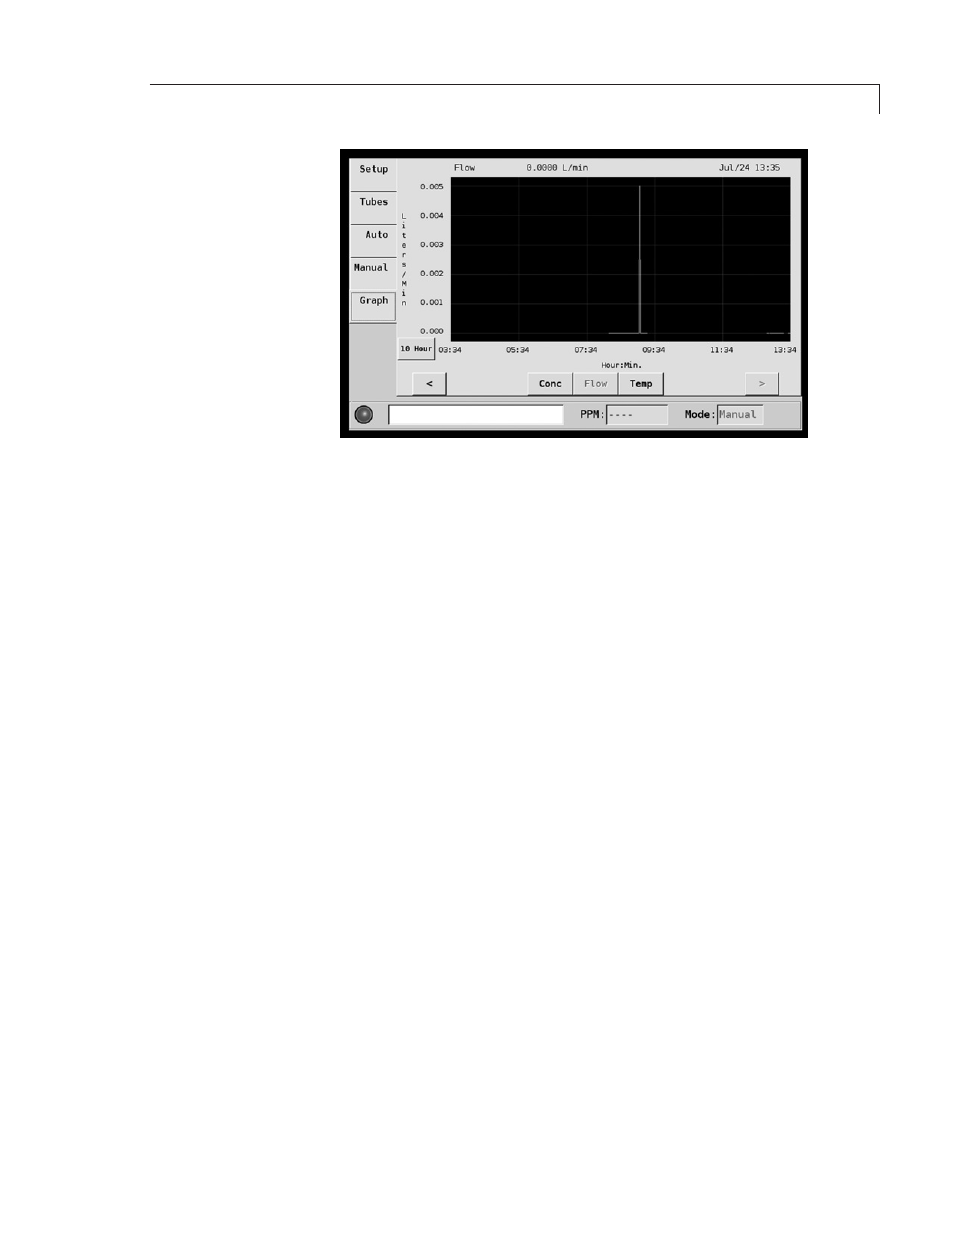
Flow
Select the Flow button to display the total flow logged for the instrument
on a 10 hour, 24 hour, or 7 day graph. you may scroll to a particular point of
interest by touching anywhere inside the graph screen to resolve down to a
single point, whose value is then presented at the top of the graph
Temp
Select the Temp button to display the oven temperature values in °C.
Choose the 10 hour, 24 hour, or 7 day graph, then scroll to an individual point
on the line. Time and value of the point will be shown in the border above
the graph.
Figure 12: Model 345 Graph screen (Flow)