Image overlay on the user interface – ChemoMetec NC-200 User Manual
Page 25
991-0204 Rev. 1.1
September 2012
25
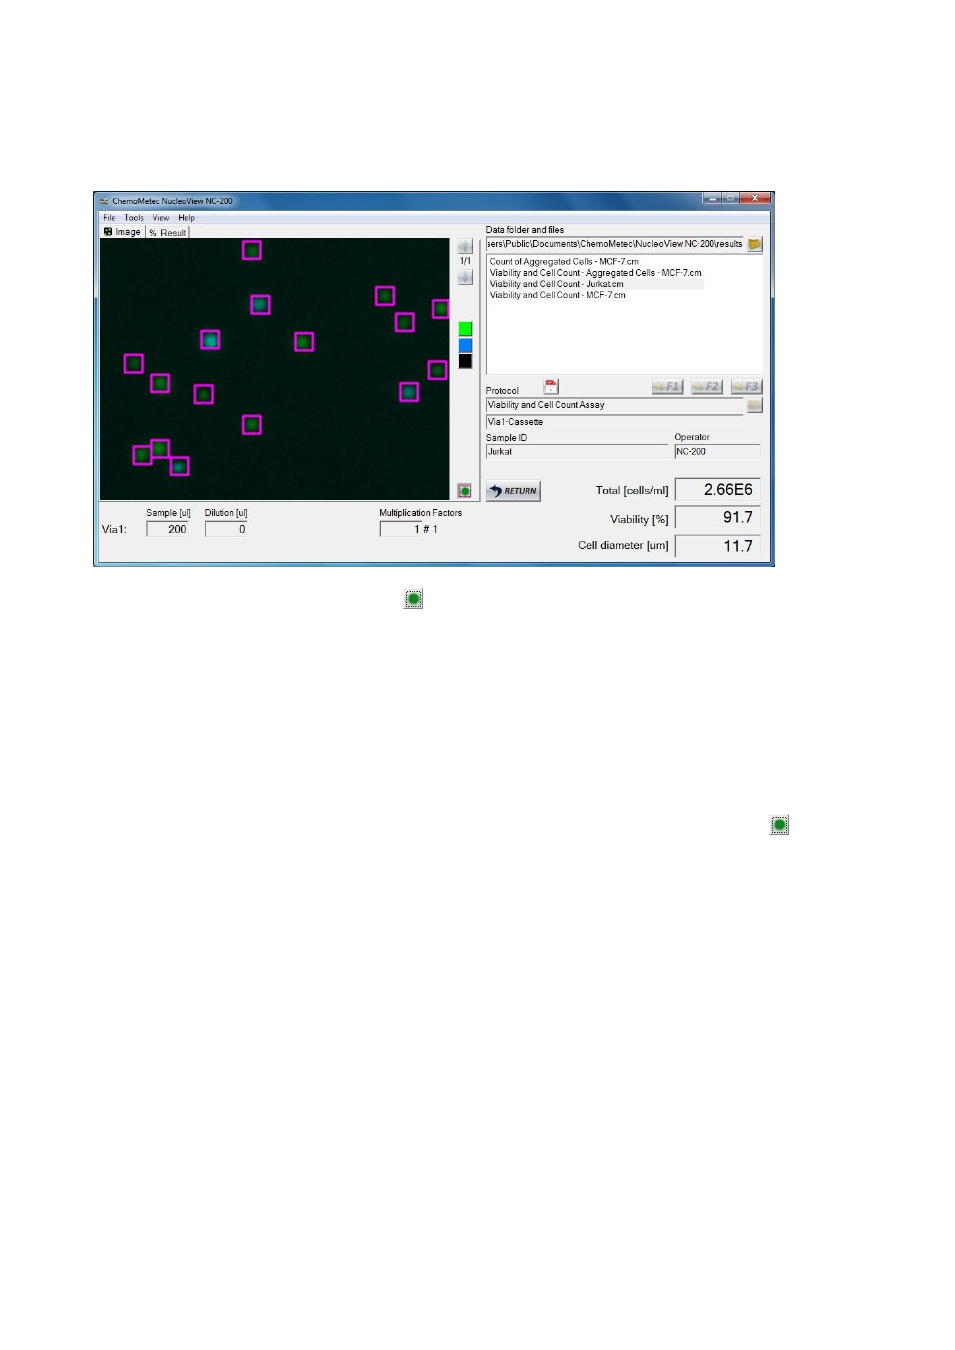
Image Overlay on the User Interface
An image overlay may be enabled with the
button in the right bottom corner of the image. It performs
two kinds of cell marking on the displayed image:
When an analysis is completed successfully, cells that are included in the total count are marked
with a square.
When a large scatter plot or a large histogram is open in the plot manager the cells inside or
outside the selected marker or gate respectively, can be marked with the overlay rectangles.
Example: The above image shows that cells inside the polygon P1 has been added to the image overlay by
right clicking on the selected gate and selecting Add Cells Inside Selected Gate to Image Overlay.
The cells are marked with rectangles and this overlay can be toggled on and off by clicking the
button.
See the large scatter plot for details about polygons and cell gating. See the large histogram plot for details
about markers and cell gating.