Annual gain (best 30 cases), Maximum drawdown – EdgeWare FastBreak Standard Version 6.2 User Manual
Page 65
65
then selecting the sort command. The effect is to put the cases in order of decreasing re-
sults. Do this for both summary files.
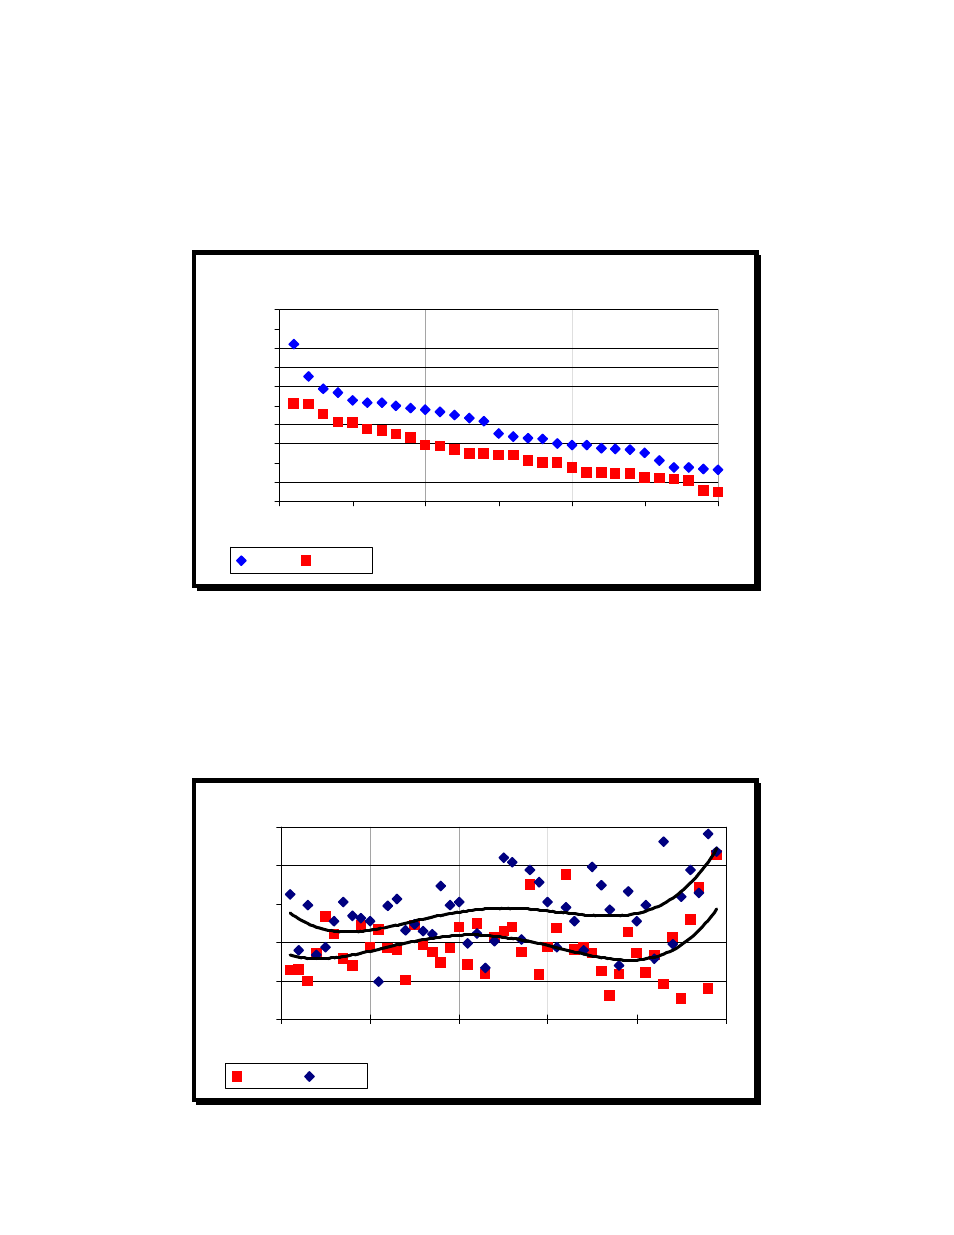
Now, re-chart the data, but only for the best 30 test cases, and the following chart will be
created:
Annual Gain
(best 30 cases)
25
27
29
31
33
35
37
39
41
43
45
0
5
10
15
20
25
30
Test Case, best-worst
A
n
n
u
a
l
G
a
in
,
%
1 fund
2 funds
Now it becomes clear that holding one fund usually has better performance than holding
two funds, on the order of 2-3% per year.
Other parameters in the summary file can be charted in a similar manner. For example,
chart the maximum draw down for these two FastBreak runs and put polynomial curve
fits through the data:
Maximum Drawdown
10
15
20
25
30
35
0
10
20
30
40
50
Test Case, best-worst
M
a
x
im
u
m
D
ra
w
d
o
w
n
,
%
2 funds
1 fund