Figure 7, Poweredge r820 cpu utilization – Dell PowerEdge R820 User Manual
Page 14
Dell Virtualization Solution for Microsoft SQL Server 2012 using PowerEdge R820
14
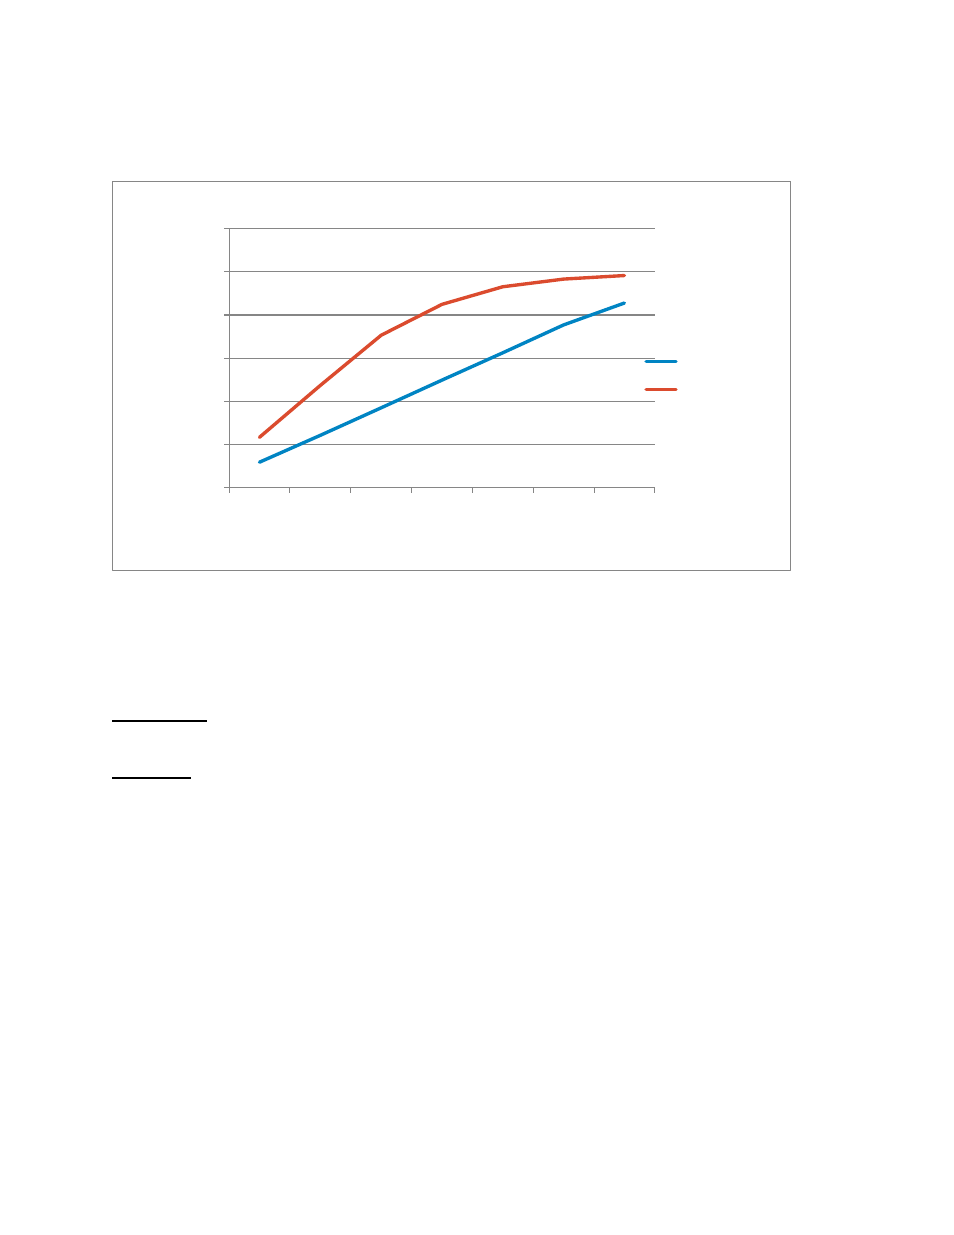
Figure 7 depicts the Hyper-V host CPU utilization observed on scaling up the VMs on the R820
PowerEdge R820 CPU Utilization
Figure 7.
Measuring the processor utilization counter “Processor(*)\%processor time” on the host may not give
the accurate CPU utilization results, to measure the total processor utilization on the host machine
“\Hyper-V Hypervisor Logical Processor(_Total)\% Total Run Time” counter being used.
Medium VMs: We observed a linear scalability in the CPU utilization as well with the increasing number
of database VMs.
Large VMs: Observed linear scalability on adding 1 to 4 large VM’s, adding more large VMs impacted
overall virtual machine server performance.
We are using 16 physical cores in this configuration, running 4 VM’s with each having 4 virtual
processors occupying all of the 16 cores. Adding more than 4 VM’s with 4 virtual processors would
actually sharing the same 16 physical cores; hence, we could see slight performance impact.
Please note that for the above test results, we have enabled only 4 Cores per processor. The hyper
threading (HT) feature is disabled on the R820 host machine. On enabling processor HT, we could see
that the R820 could accommodate more VMs, with lesser performance impact as compared to the HT
disabled configuration.
0
20
40
60
80
100
120
1 VM
2 VMs 3 VMs 4 VMs 5 VMs 6 VMs 7 VMs
Medium VM's
Large VM's
No. of virtual machines
Hyp
er
-V
Hyp
ervi
so
r
Lo
g
ical
P
ro
ces
so
r(
_
T
o
tal)
\
% T
o
tal
R
un
T
ime
R820 Processor Utilization