Table 3, Figure 12, Total storage cost comparison – Dell Compellent Series 40 User Manual
Page 16: Total cost, Total storage cost comparison figure 12
Cost and Performance benefits of Dell™ Compellent™ Automated Tiered Storage for Oracle® OLAP
Workloads
16
Results summary: performance, cost, and disk space usage
Table 3.
Note: Refer Appendix for the sample cost used for the above cost calculations.
T1 – Tier 1 Storage Space (SAS 15K RPM)
T2 – Tier 2 Storage Space (SAS 10K RPM)
T3 – Tier 3 Storage Space (SAS 7.2K RPM)
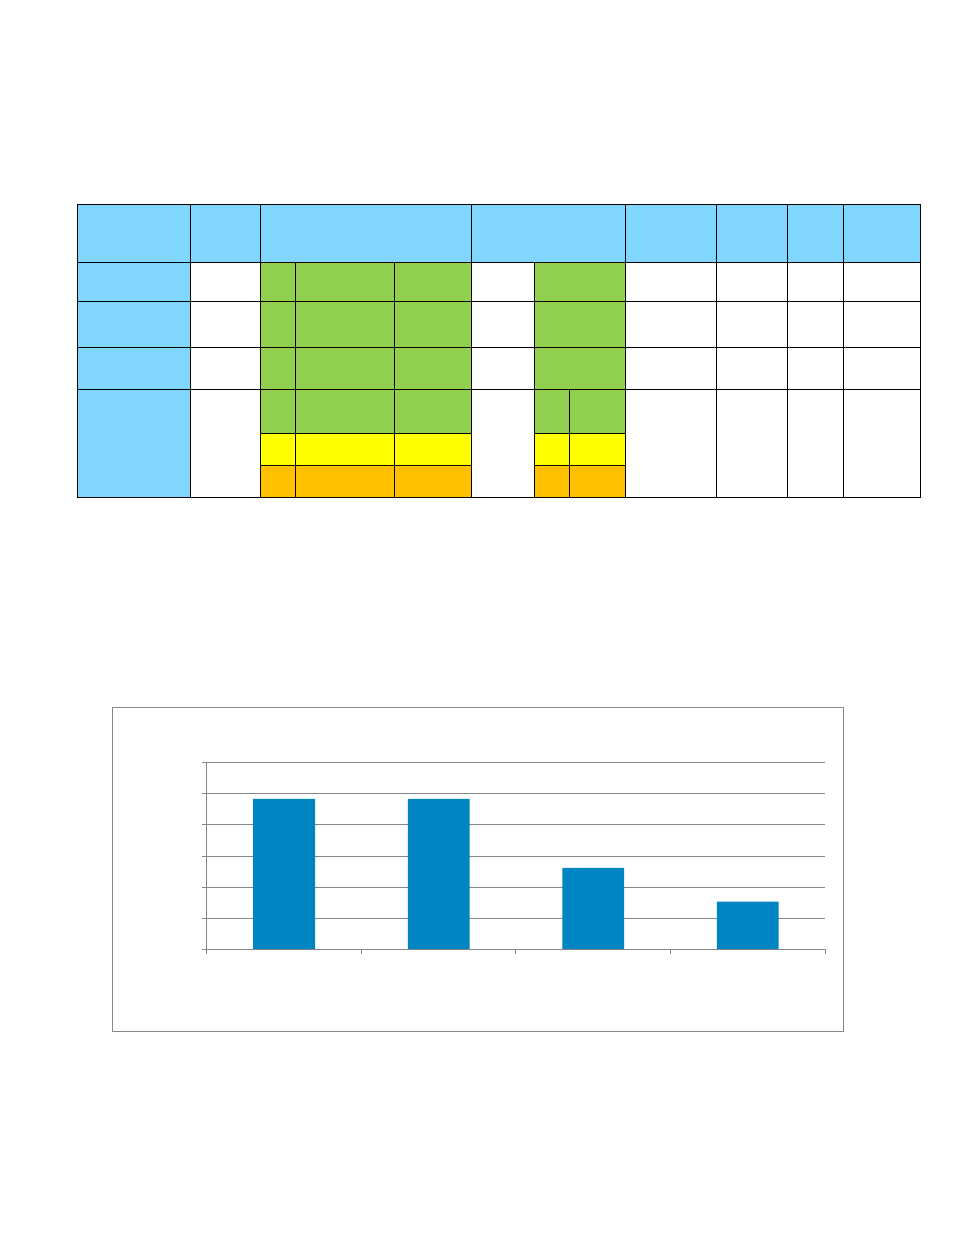
Figure 12 shows the overall summary of total storage cost.
Total storage cost comparison
Figure 12.
The table 3 shows the baseline configuration with only Tier 1 storage on a RAID 10 configuration. The
response time was 448 minutes and the total cost per GB is 1.13$, whereas with the same configuration
enabled with Compellent Fast Track and Replay features achieved an improved performance of 345
2416
2416
1311
770
0
500
1000
1500
2000
2500
3000
Baseline Test
Fast Track Enabled
Replay Enabled
After Data
Progression
Optimized
T
o
tal
Co
st
(in $)
Total Cost
Overall
volumes
size(GB)
Volume size distribution in tiers
and RAID types
Disk space
consumed
Disk space
saved in
Tier1
Total
cost($)
Cost
per
GB($)
Aver.
response
time
(min)
Baseline
configuration
950
T1
R10 Standard
950 GB
1.85 TB
All in T1
-NA-
2147
1.13
448
Fast Track
Enabled
950
T1
R10 Fast
R10 Standard
461 GB
491 GB
1.85 TB
All in T1
-NA-
2147
1.13
345
Replay Enabled
1013
T1
R10 Fast
R5-9 Standard
21 GB
994 GB
1.13 TB
All in T1
737 GB
1312
1.13
344
After Data
Progression has
optimized
1018
T1
R10 Fast
R5-9 Fast
R5-9 Standard
21 GB
22 GB
167 GB
1.35 TB
T1
256GB
1.60 TB
770
0.55
343
T2
R5-5 Fast
R5-5 Standard
290 GB
63 GB
T2
442GB
T3
R6-6 Fast
R6-6 Standard
4 GB
451 GB
T3
690GB