Figure 10, Average response time – Dell Compellent Series 40 User Manual
Page 14
Cost and Performance benefits of Dell™ Compellent™ Automated Tiered Storage for Oracle® OLAP
Workloads
14
In the above graph we observed that after enabling Data Instant Replay, the data migrated to RAID 5-9
from RAID 10. Moving this read-only data from RAID 10 to RAID 5-9 within the same tier enables to
maintain the same read performance and frees up space on the RAID level.
In the Baseline test, without enabling Replay, the disk space consumed for all volumes is 1.85TB with
all the data residing on a RAID 10. After enabling Data Instant Replay, all the read-only data was
identified and automatically moved to RAID 5-9. As a result, the total disk space consumed was
reduced to 1.13 TB. Enabling Replays helped to shrink disk space by 39 percent and delivered the same
performance.
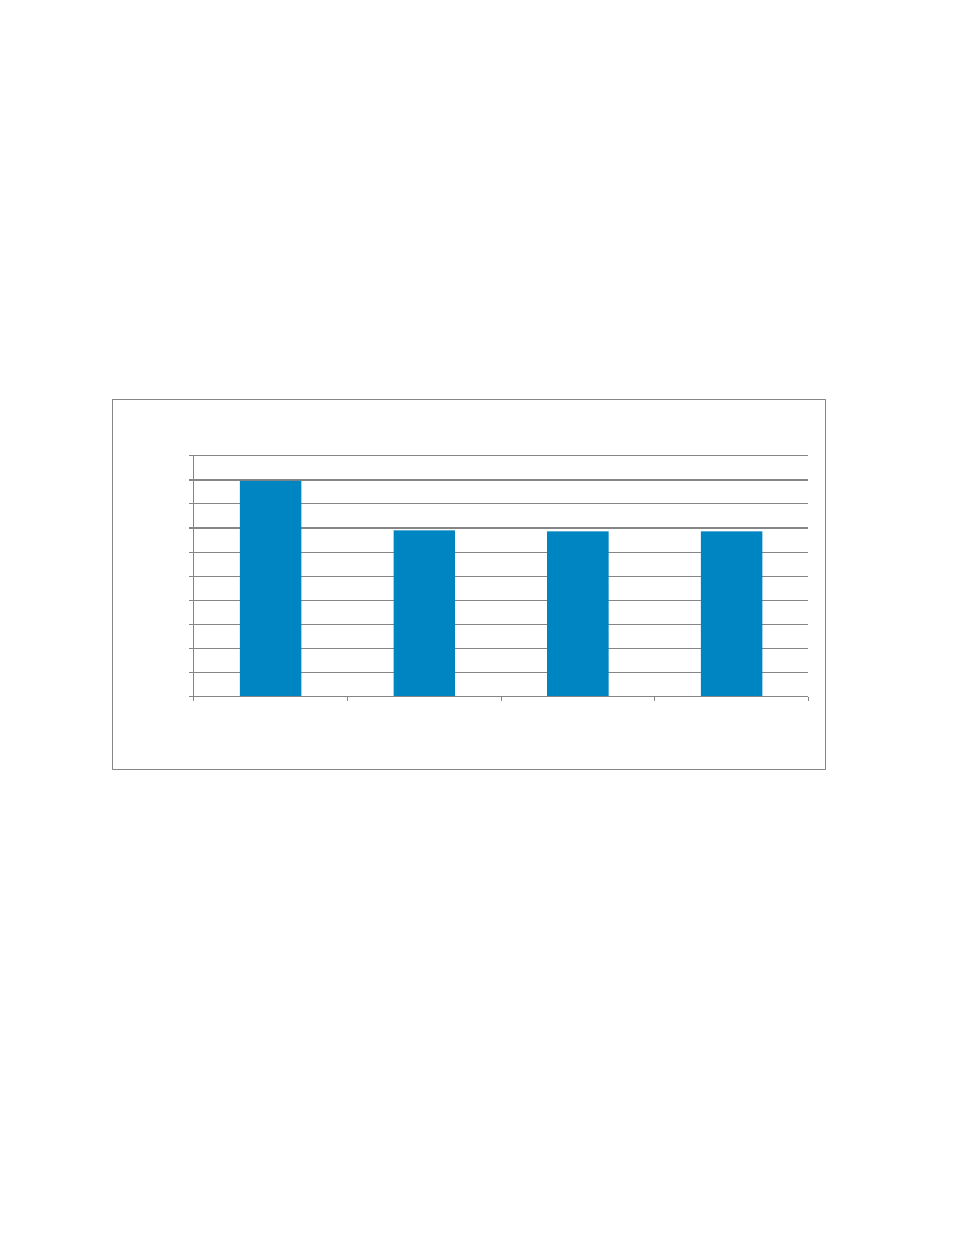
Figure 10 shows the response time comparison between the baseline configuration and with all the
Compellent auto-tiering features enabled.
Average response time: Baseline vs. Auto-tiering features enabled
Figure 10.
Based on the above test results, when we enable the Compellent auto-tiering features (Fast Track,
Data Instant Replay, and Data Progression), we observed that there is no degradation in terms of query
response time. The test results are well below the baseline test query response time and helped to
save disk space.
Figure 11 shows the comparison of disk space consumed in a baseline test after Data Progression with
multiple tiers. In addition, it shows the disk space tier distribution after introducing lower tiers (10K
RPM SAS and 7.2K RPM SAS drives).
0
50
100
150
200
250
300
350
400
450
500
Baseline Test
Fast Track Enabled
Replay Enabled
After Data
Progression
Optimized
A
v
er
age
Respo
n
se
T
ime (
min
)
Average Response Time