Protocol, Protein molecular weights, Stock sample buffer (store at room temperature) – Bio-Rad Unstained SDS-PAGE Standards User Manual
Page 3
Protocol
Dilute standards 1:20 in SDS Reducing Sample Buffer.*
Heat for 5 minutes at 95 °C. Cool and load 10 µl/well for full
length gels (16-20 cm) or 5 µl/well for mini gels. These load
volumes and dilutions have been optimized for development
with Bio-Rad Silver Stain or Silver Stain Plus for approxi-
mately 10 minutes. If silver stain development times vary, the
loading volume or dilution of the standards may need to be
adjusted to optimize the band intensity.
* SDS Reducing Sample Buffer (Prepare imme-
diately before use)
ß-mercaptoethanol
25 µl
Stock sample buffer
475 µl
500 µl
Stock Sample Buffer (Store at room temperature)
Distilled water
4.8 ml
0.5M Tris-HCl, pH 6.8
1.2 ml
Glycerol
1.0 ml
10% (w/v) SDS
2.0 ml
0.1% (w/v) bromophenol blue
0.5 ml
9.5 ml
Use of stock sample buffer with insufficient or old ß-mer-
captoethanol may result in doublets at the soybean trypsin
inhibitor and ovalbumin bands.
3
Protein Molecular Weights
Molecular
Protein
Weight
References
Rabbit muscle
97,400
Titani, K., et. al., Proc. Natl. Acad. Sci.
phosphorylase b
USA, 74, 11, 4762 (1977).
Bovine serum
66,200
Brown, J. R., Fed. Proc., 34, 591 (1975).
albumin (BSA)
Hen egg white
45,000
Warner, R. C., "Egg Proteins," in: The
ovalbumin
Proteins, Vol. IIA, p. 435 (Neurath, H.
and Bailey, K., eds.), Academic Press,
New York (1954).
Bovine carbonic 31,000
Davis, R. P., "Carbonic Anhydrase," in:
anhydrase
The Enzymes, Vol. V, p. 545, (Boyer,
P. D. eds.) Academic Press, New York
(1971).
Soybean trypsin 21,500
Wu, Y. V. and Scheraga, H. A., Bio-chem-
inhibitor
istry, 1, 698 (1962).
Hen egg white
14,400
Jolles, P., Angew. Chem., Intl. Edit., 8 227
lysozyme
(1969).
4
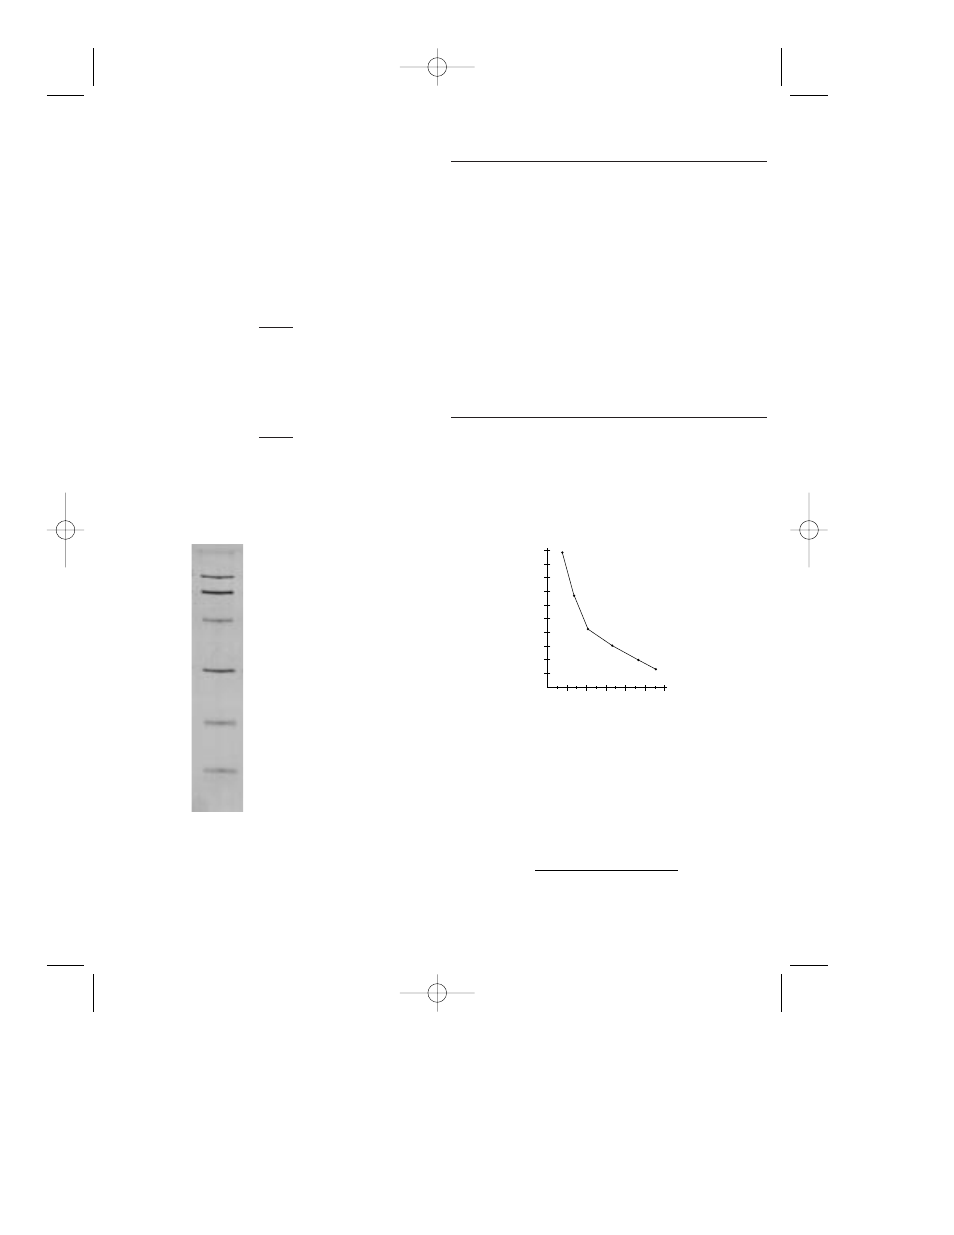
Fig. 1. Silver Stain SDS-PAGE Standards give bands
of even intensities when stained with Bio-Rad's Silver
Stain or Silver Stain Plus.
Note that no extraneous
bands are present. Low range standards run on a 12.5%
SDS polyacrylamide gel and stained with Bio-Rad's Silver
Stain Kit.
5
Phosphorylase b
Bovine serum
album
Ovalbumin
Carbonic
anhydrase
Soybean trypsin
inhibitor
Lysozyme
Fig. 2. Curve generated by plotting the molecular
weight of the low range molecular weight standards
run on a 12% SDS polyacrylamide gel vs. the dis-
tance migrated from the interface of the stacking and
separating gels in centimeters.
An alternative method
is to plot the log
10
relative mobility (R
f
) vs. the gel con-
centration, %T, (percentage total monomer, i.e. grams
acrylamide plus bis acrylamide/100ml).
R
f
=
distance migrated by protein
distance migrated by dye
The curve can be used to determine molecular weights of
unknown proteins.
2
100
90
80
70
60
50
40
30
20
10
Daltons
12
10
8
6
4
2
cm
6
4006047C 8/28/98 03:48 PM Page 2