Displaying recorded data – Monarch Instrument Track-It User Manual
Page 9
Track-It User Guide
Page 9
Rev 1.02 06/21/11
- Start Live Data
This allows the display (and recording if enabled under
) of real time data from the connected device.
Data will plot on the graph and show on the Digital Indicators if these are enabled under
- Stop Live Data
This allows the display of live data to be stopped.
- Pause / Run Live Data
Only visible during Live Data display. If running the Pause icon will be visible and is used to pause live data
display, note that data continues to be acquired and when the Play icon is pressed the graph will “catch up” to real
time. No data is lost. If paused, the Run icon will show.
There is a TEXT BOX at the top of the graph. By default this will contain the Unit Tag but the user can choose to write
anything here. This is useful as it is printed on the printout.
3.6.2. Displaying Recorded Data
Data can be loaded from a file or uploaded from a connected device. To open a previously saved file press the File open
icon
and select the file. To upload recorded data from a connected device press the Upload Data icon
and follow
the instructions. Once loaded the data is displayed on the graph. Use the icons above to navigate around. Use the Zoom X-
Axis to Fit icon to see an overall trend.
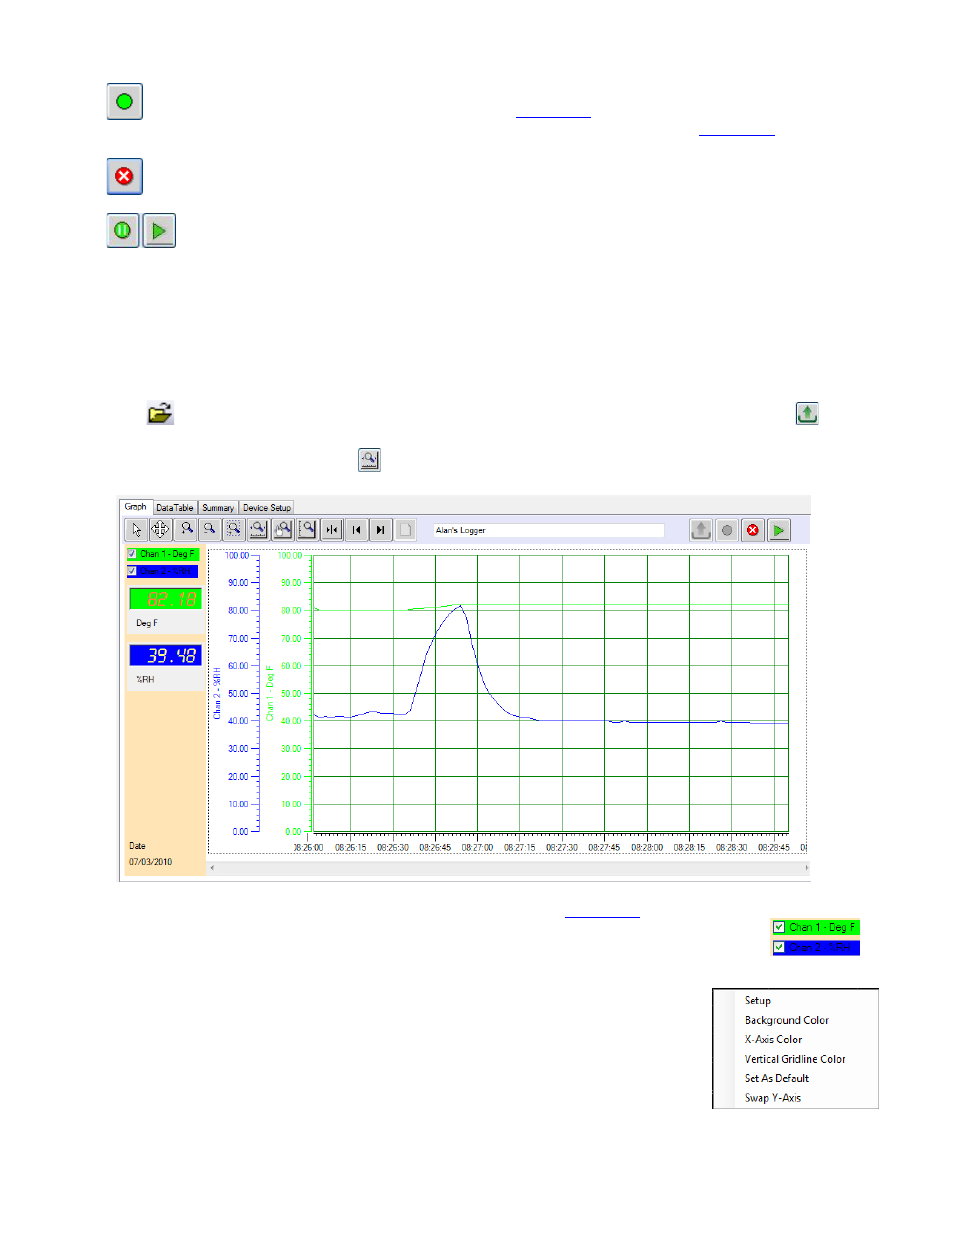
. A typical graph is shown below.
Note: This display shows the digital readouts (on the left) enabled in the
On the top left are the trend identifiers, above the digital readouts
– these identify the channel by trend
color. By unchecking the boxes you can shut off the corresponding trace. The vertical scales for each
channel will be in the corresponding color of the trace for easy identification as is the background of the digital display.
If you move the cursor anywhere on the graph and right click the mouse you will bring up the
setup menu shown below. There are several options: