(graph) setup, Background color, X-axis color – Monarch Instrument Track-It User Manual
Page 10: Vertical grid line color, Set as default, Swap y-axis, Digital display setup, Using the cursor, Value - xy, Dual point
Track-It User Guide
Page 10
Rev 1.02 06/21/11
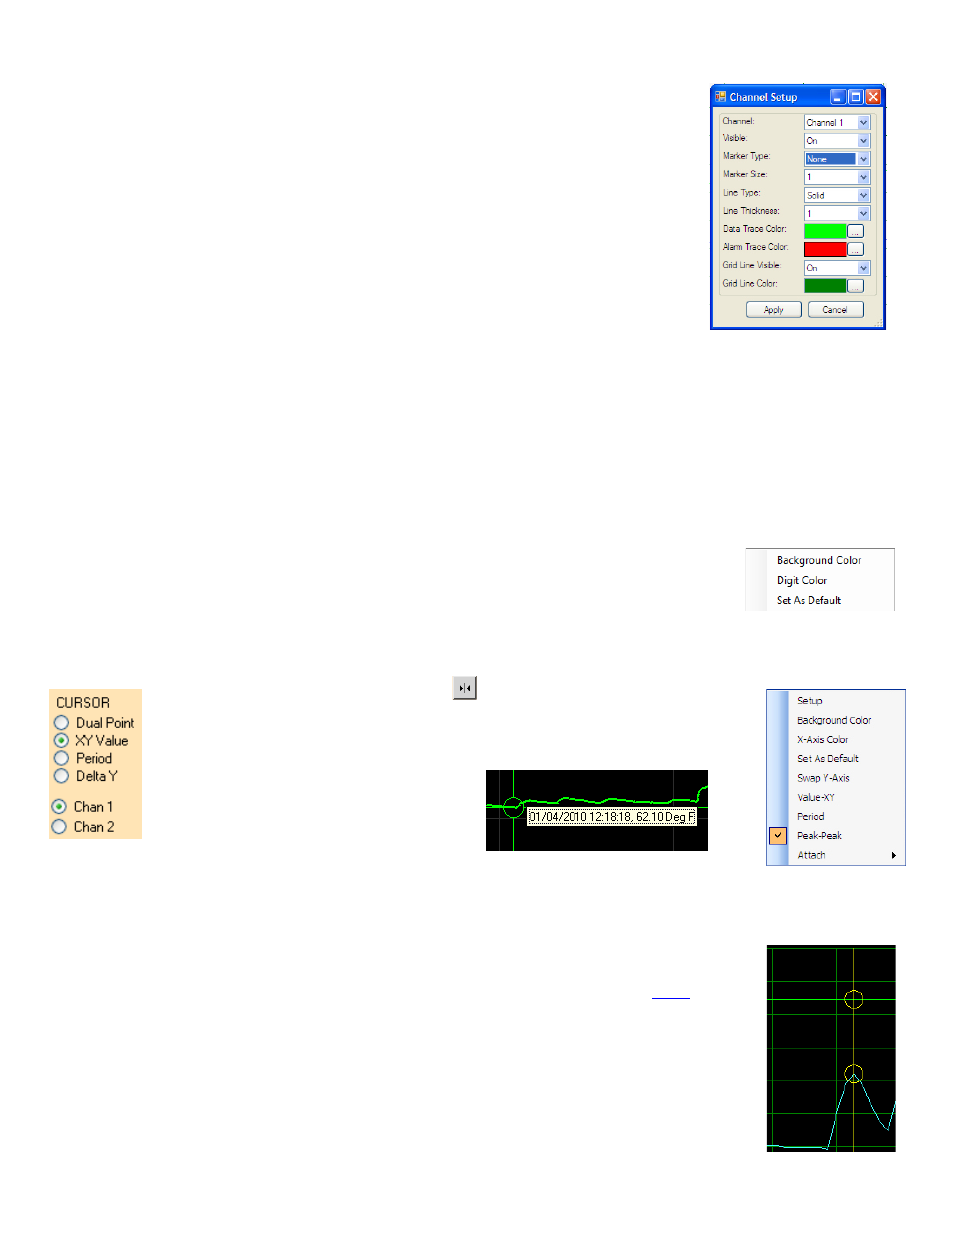
3.6.2.1. (Graph) Setup
The Channel Setup dialog allows the user to modify the properties of each channel.
Channel
Selects a channel
Visible
Turns the trace on or off for the selected channel
Marker Type
Identifies the actual points recorded. The trace is extrapolated
between these points. The points can be marked by a square,
circle or diamond. The user can also select None for no marker.
Marker Size
Adjusts the size of the marker on the points.
Line Type
Identifies the trace type. It can be solid, dashed or dotted.
Line Thickness
Adjusts the thickness of the trace.
Data Trace Color
Changes the trace color for the selected channel.
Alarm Trace Color
Changes the alarm trace color for the selected channel.
3.6.2.1.1. Background Color
Allows the graph background Color to be changed
3.6.2.1.2. X-Axis Color
Allows the graph X-Axis color to be changed
3.6.2.1.3. Vertical Grid Line Color
Allows the Vertical grid line color to be changed
3.6.2.1.4. Set As Default
Save the current settings as default.
3.6.2.1.5. Swap Y-Axis
Swap the position of the vertical scales.
3.6.2.2. Digital Display Setup
The Digital Display Setup dialog is accessed by right clicking on the digital display active
area. The user can set the display background color and the color of the digits as described
above. The settings may also be "Set as Defaults" and will be remembered each time the
program is started.
3.6.3. Using the Cursor
The cursor is turned on using the Cursor icon
. When the cursor is on, a number of options
appear on the left hand side of the window as shown left. Some of these cursor choices can be
selected by right clicking the mouse button on the graph which brings up the cursor setup menu
shown right. The cursor modes are described here:
3.6.3.1. Value - XY.
This uses a single cursor to identify a point on the
trace as shown here. When the mouse is moved
over
the cursor line the pointer will turn into a pointing
finger. If you left click at this time you can drag the cursor line left or right, the data in the
travelling window will update the time and value of the point in the target circle. You can attach the cursor to the other
trace by using the right click pop-up menu - "Attach" option, or simply click Chan 1 or Chan 2 radio button on the
cursor menu on the left. Pressing the "S" key on the keyboard will also switch between traces.
3.6.3.2. Dual Point
This brings up the cursor with targets around both traces as shown right. The values of the data
within the target circle is shown at left in two digital panel meter windows shown
. The time
stamp of the data point is below these windows and the date stamp is at the bottom left of the
window. . When the mouse is moved over the cursor line the pointer will turn into a pointing
finger. If you left click at this time you can drag the cursor line left or right, the data in the digital
panel meter windows will update.