Graph tab, Icons – Monarch Instrument Track-It User Manual
Page 8
Track-It User Guide
Page 8
Rev 1.02 06/21/11
3.6. Graph Tab
The Graph tab allows for the visualization of data. The user can choose to load an already saved file using the
data from a connected device or View data in real time (select loggers only)
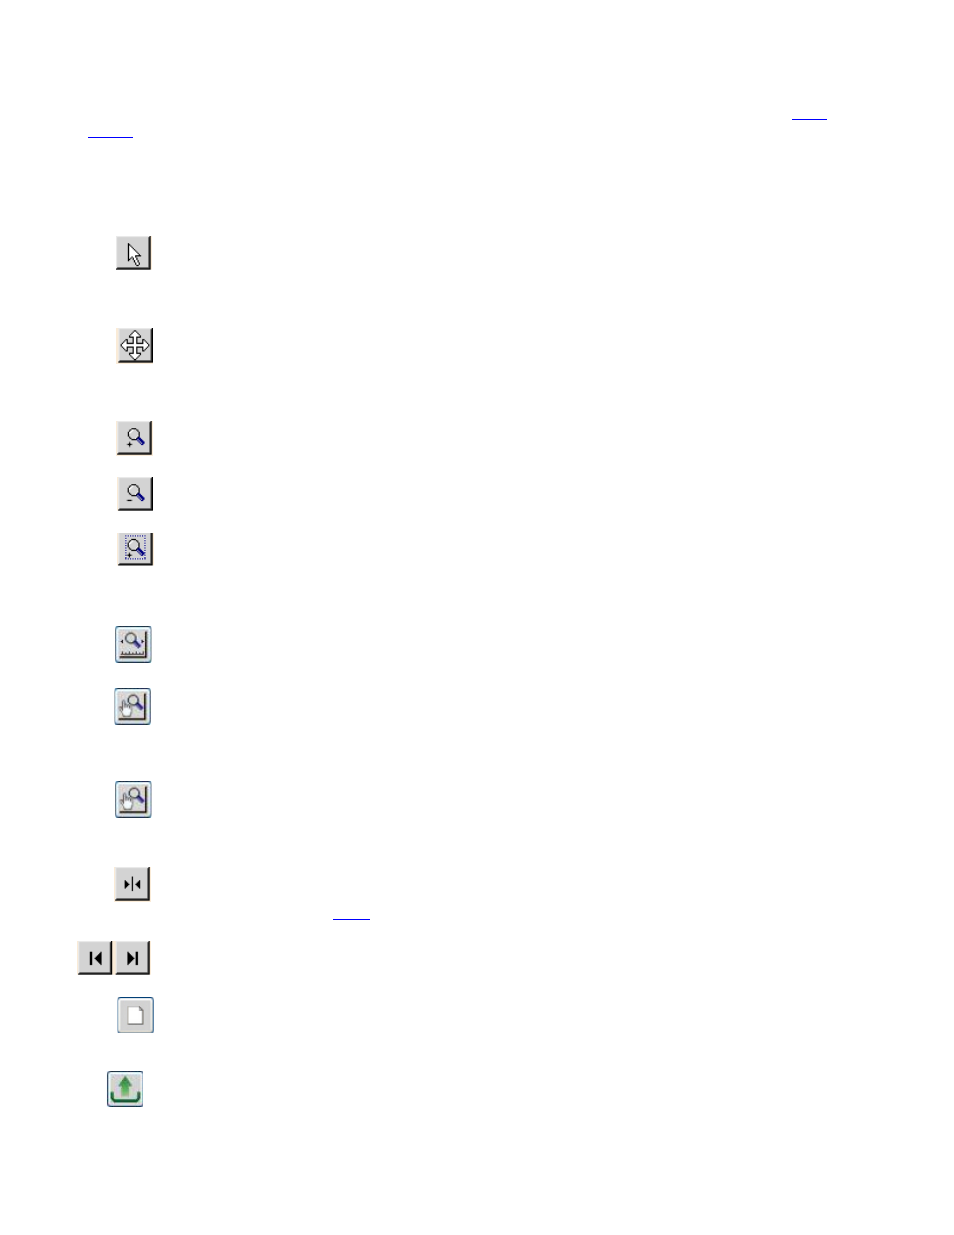
3.6.1. Icons
The graphic area is fully interactive. Data can be zoomed and scrolled, the interaction controlled by the icons above the
graph. Mouse over the icons for a brief description of their function.
- Pan
This is the default cursor. It is used to scroll the trends horizontally and vertically by simply right clicking in the
graphics area. Traces can be scrolled individually by clicking and dragging the individual vertical scales or together by
clicking and dragging in the graphics area.
- Expand / Compress
Click this button to expand (zoom) or compress the graph along the x-axes (time) and y-axis (scale). Traces can be
zoomed individually by clicking and dragging the individual vertical scales or together by clicking and dragging in the
graphics area.
- Zoom In
Click this button to zoom in the graph.
- Zoom Out
Click this button to zoom out the graph.
- Zoom Window
Click this button to zoom to a user-defined window. When clicked, the cursor will turn into a draw window tool. Draw
a window around the area of interest by holding the right mouse button and dragging the window. On release, the
window area will fill the graphics screen.
- Zoom X-Axis to Fit
Click this button to fit all data into one screen.
- Manual Zoom to Fit
Click this button to manually zoom the vertical (Y) Axis. This will pop up the Manual Zoom window. Enter the
minimum and maximum vertical Axis scale values and check which channel to apply it to, then press the “OK” button
to execute or “Cancel” to exit.
- Zoom Scales
Click this button to zoom the vertical (Y) Axis to the defaults. This will pop up the Zoom Scales window. Check which
channel to apply it to, then press the “OK” button to execute or “Cancel” to exit. The vertical scales will zoom to the
default extremes.
- Cursor
Click this button to enable the cursor. There are several cursor options to enable in depth examination of the data on
the graph. See Section 3.3.6
- Scroll to End
Click either the left or right scroll button to jump to the start or end of the data.
- Clear
Click this button to clear the graph and return to the start up state.
- Upload Data from Device
This allows the user to retrieve the current recorded data in the device. If selected it will ask for a file name. This
operation will stop any recording currently in progress on the device. If there is no recorded data in the device you will
get a message to that effect. A device must be connected in order to perform this task.