3 performance charts – Trebor 110E User Manual
Page 10
PAGE 10
MODEL 110E PUMP OPERATION / MAINTENANCE MANUAL
White arrow on top of knob indicates approximate cycle time in seconds.
Rotate CW to slow cycle rate.
Rotate CCW to increase cycle rate.
NOTE: Operate pump at slowest possible cycle rate that will deliver desired flow.
This will extend pump diaphragm life!
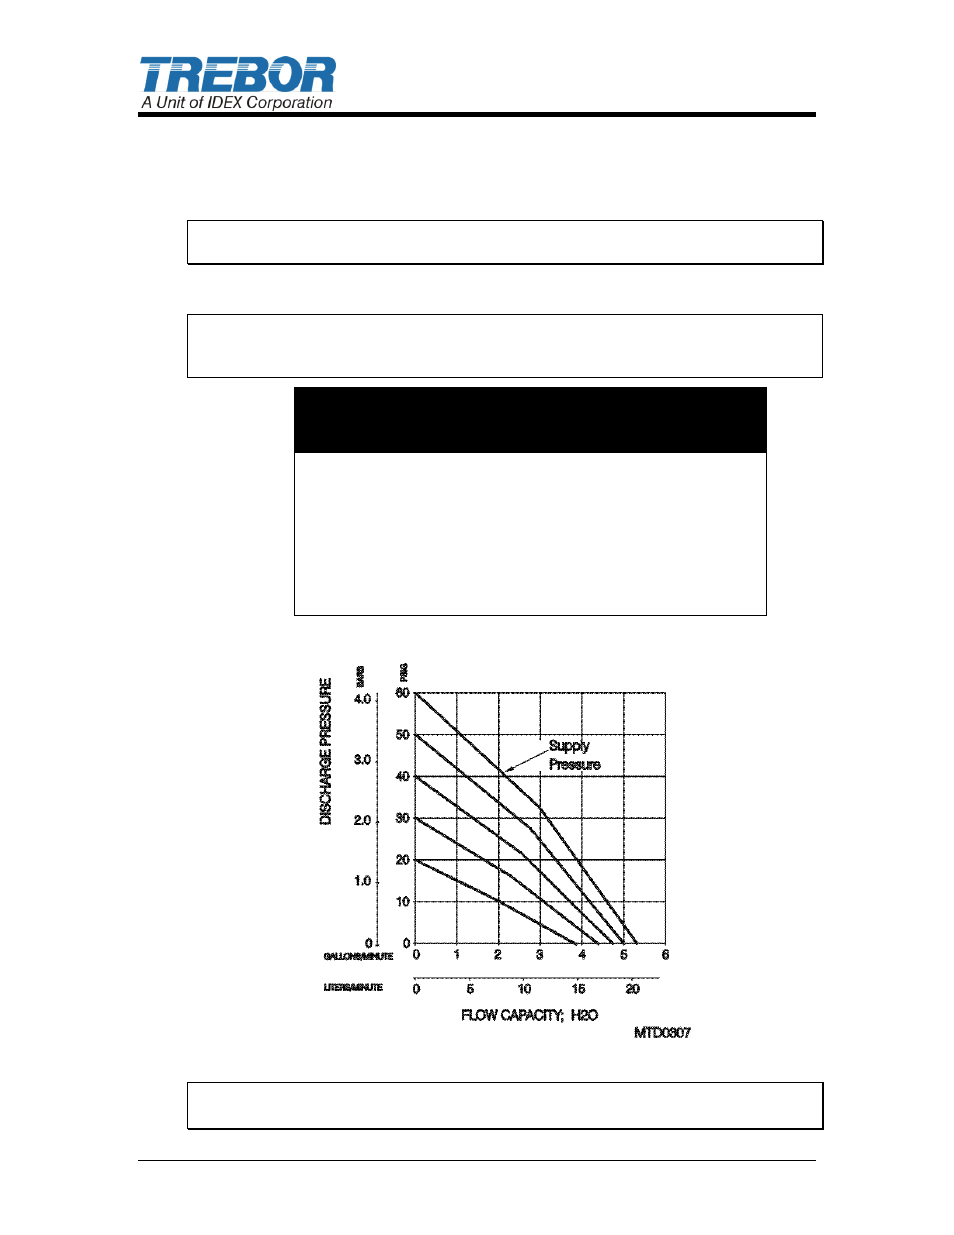
3.3 PERFORMANCE CHARTS
Pumping capacity is a function of air supply pressure and volume, suction head,
suction line restrictions, discharge head, discharge line restriction, and fluid
specific gravity and viscosity.
Air Supply
Pressure
(PSIG)
Discharge
Fluid
Pressure
(PSIG)
Air
Used
(SCFM)
Cycles
Per
Minute
Displacement
IN
3
Per
Cycle
20
0
2.0
210
4.1
20
10
1.7
125
3.7
30
0
5.0
245
4.1
30
15
3.0
145
3.8
40
0
5.2
255
4.3
40
20
4.2
160
3.9
50
0
6.9
265
4.4
50
25
5.9
175
4.1
60
0
8.5
290
4.2
60
30
7.4
180
4.1
Table 1: Consumption / Efficiency
Figure 3-1: Pressure & Capacity Chart
NOTE: Test information is based on specific conditions and limited sampling.
Use for general reference only.