View waveforms – RaySafe X2 View User Manual
Page 9
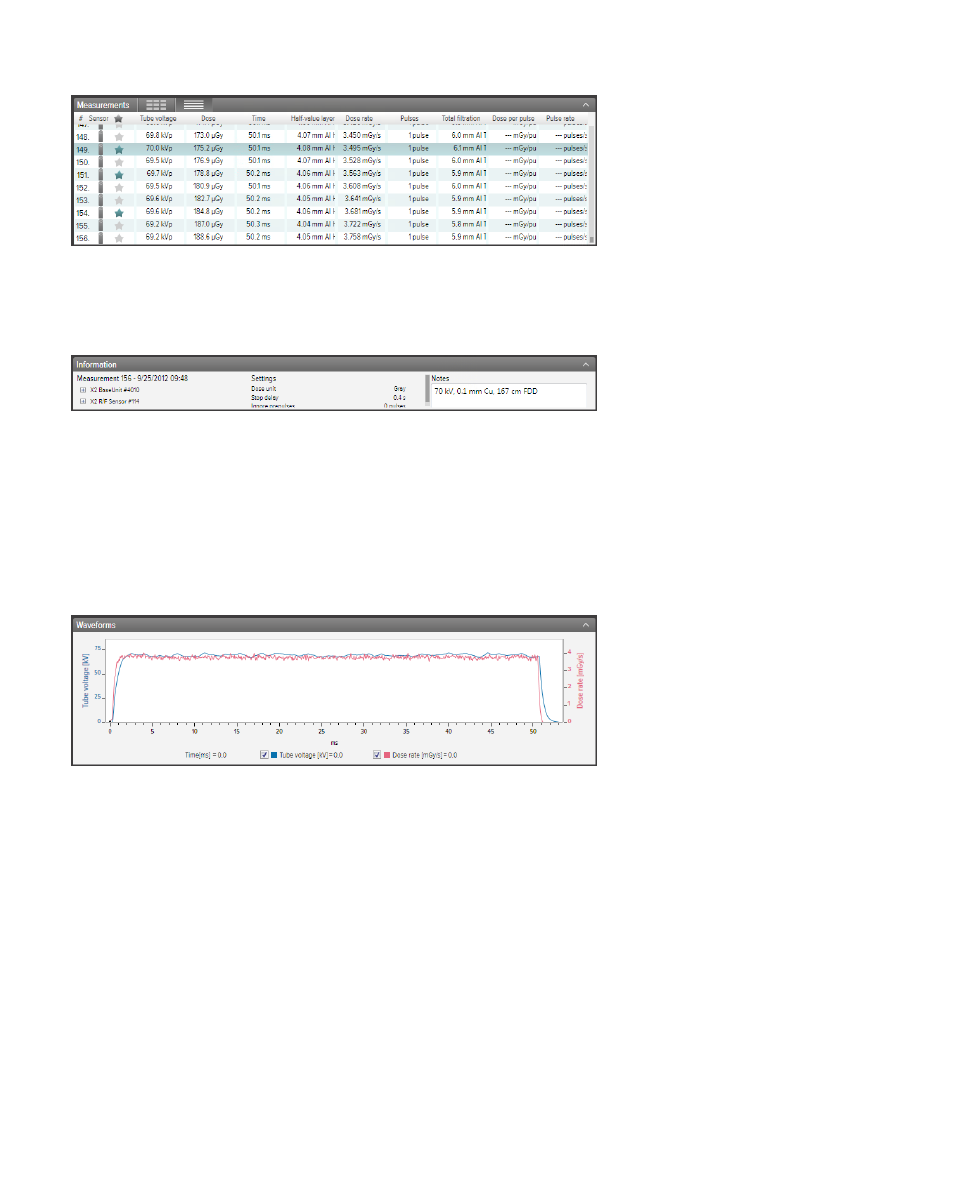
Figure 8. Starred measurements
Every measurement has an associated note field. The notes are saved along with the measurements, and are
also exported to Excel.
Figure 9. Information panel with Notes field
VIEW WAVEFORMS
Click on a measurement to see its waveforms.
The waveforms area consists of the waveforms and check boxes for showing/hiding the different waveforms.
The dark line represents the average of the collected data and the lighter cloud is the range of data points.
Figure 10. Waveforms panel
You can analyze the waveform by zoom, pan and select:
Zoom in: mouse scroll wheel up or mouse left click and drag
Zoom out: mouse scroll wheel down or mouse left double click (resets the zoom and the section mark)
Pan: left click and drag in the waveforms overview
Mark a section and view details: hold shift and left click and drag
9
RaySafe X2 View User Manual – View measurements