Continue, How to interpret the graphs (continued) – Pioneer VSX-920-K User Manual
Page 20
20
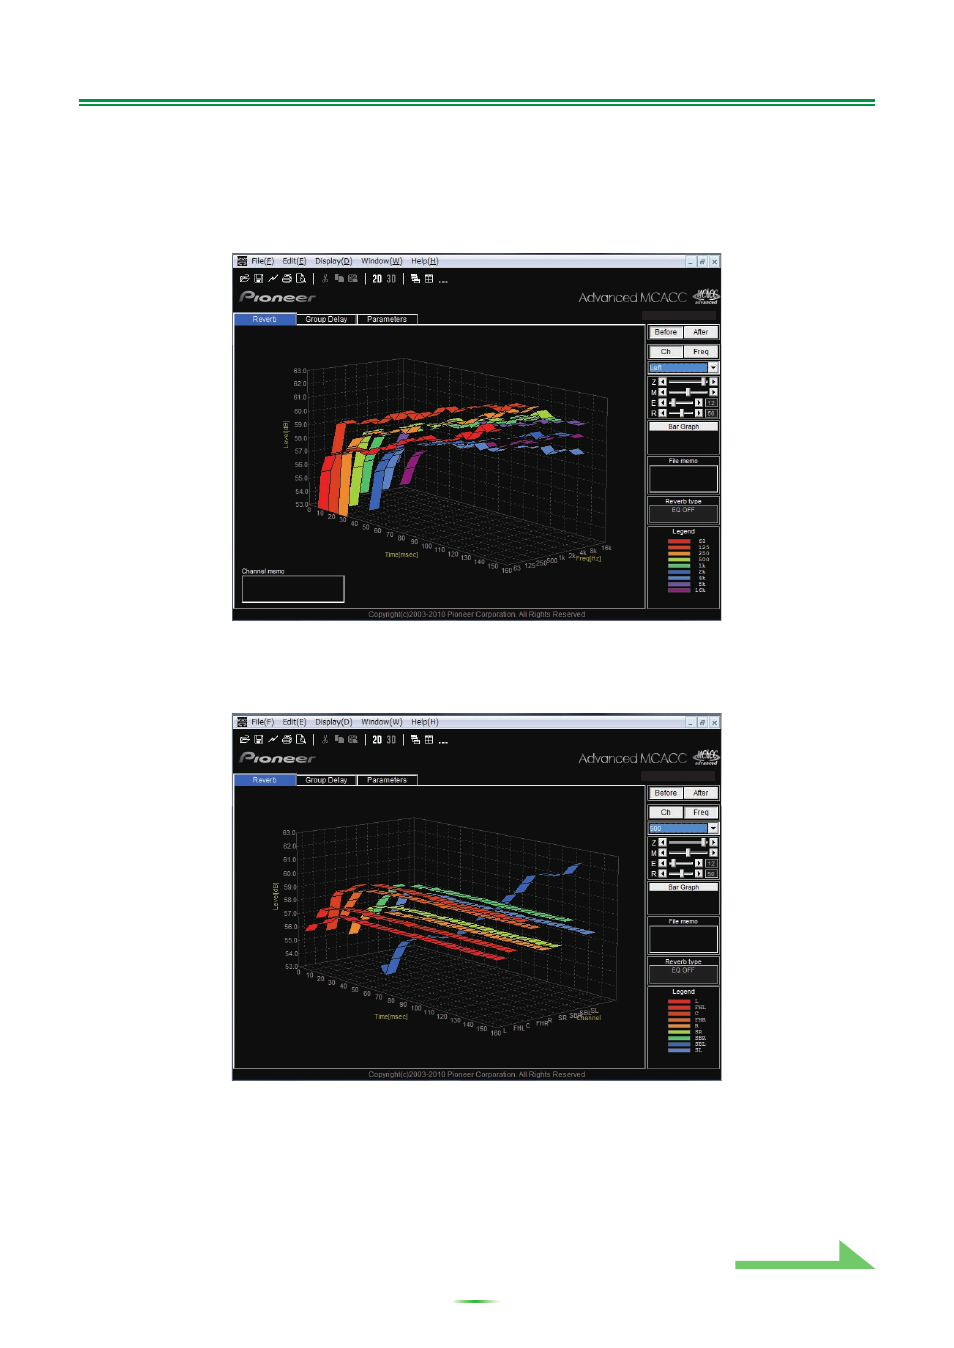
How to Interpret the Graphs (Continued)
Checking steps to improve your room’s reverb characteristics
The reverb characteristics of your listening room graphs are evident from the graphs. For your reference, the
following four examples explain how different types of rooms appear in the graphs.
Case 1: Graph rises to right across all frequencies
This is probably a room with a good deal of reverberation. If possible, we recommend that you try installing
some sound absorbent material to create a deader acoustic space according to your preference.
Case 2: Specific channel shows unusual reverb characteristics
There is probably some object near the speaker which affects sound reproduction. If possible, we
recommend that you try to reduce the influence of that object.
Jan.06
,
2010 14:05
Jan.06
,
2010 14:05