Campbell Scientific KH20 Krypton Hygrometer User Manual
Page 16
Appendix A. Calibrating KH20
4
4.5
5
5.5
6
6.5
7
7.5
8
1.74 3.02 4.17 5.44 6.71 7.95
9.2 10.47 11.69 12.9 14.22 15.46 16.78 18.04 19.25
Vapor Density (g/m
3
)
K
H
2O
O
ut
pu
t (
m
V
)
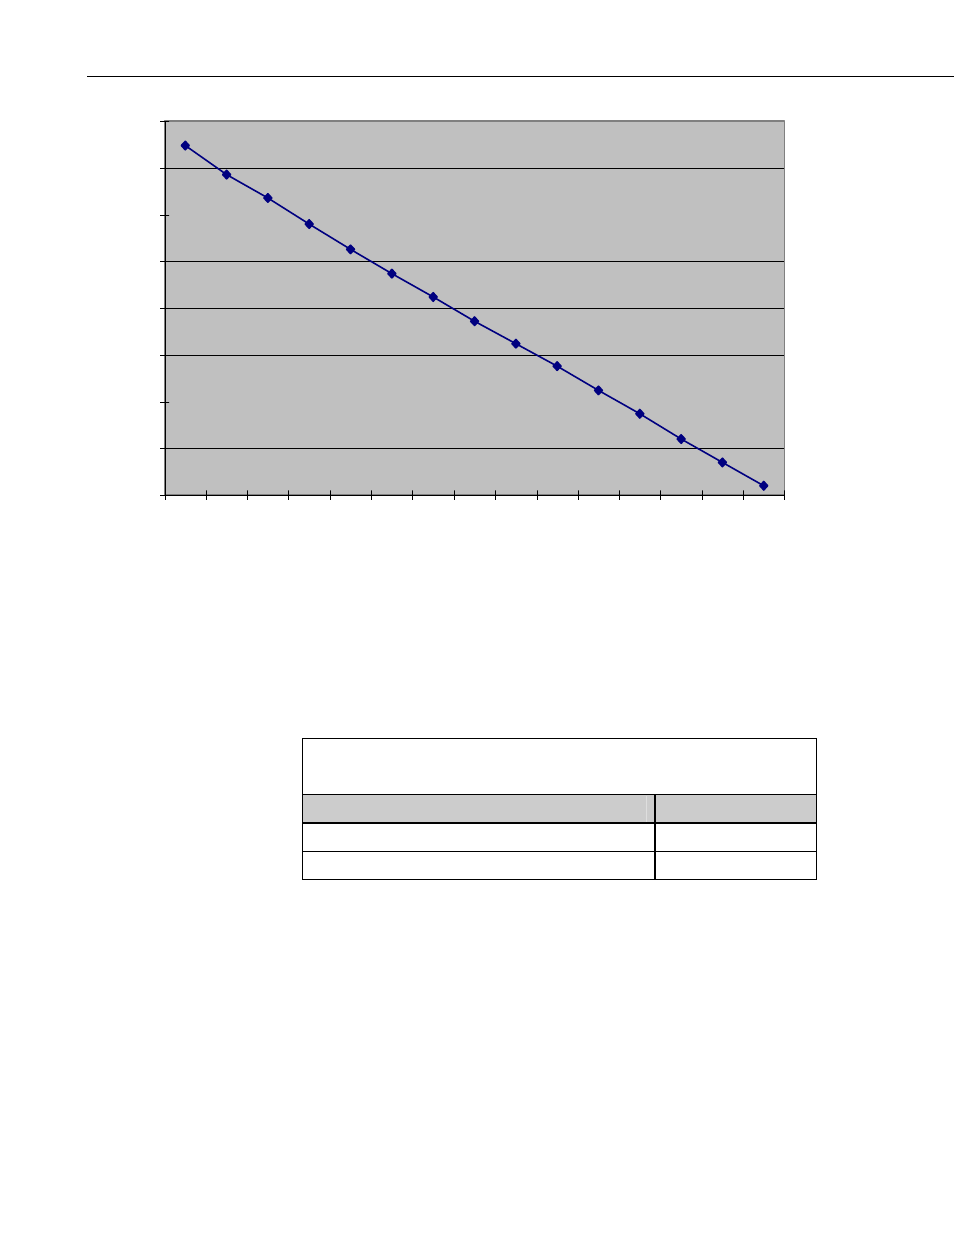
FIGURE A-1. KH20 ln(mV) vs. Vapor Density
We can perform the linear regression on the plot above to obtain the slope for
the relationship between the ln(mV) and the vapor density. The slope for the
graph above will be the coefficient, k
w
x which we are after. Table A-1 below
shows the result of linear regression analysis. Again the slope is the product of
the absorption coefficient of water vapor, k
w
, and the KH20 path length, x.
TABLE A-1. Linear Regression Results for KH20 ln(mV)
vs. Vapor Density
Description
Values
Slope (xk
w
) -0.205
Y Intercept (ln(V
0
) 8.033
If we substitute these values, along with the measured lnV into equation A-3,
we can obtain the water vapor density, ρ
w
. Campbell Scientific, Inc. performs
the calibration twice for each KH20: once with the window cleaned, and again
with the window scaled. We then break up the vapor density range into dry
and wet ranges, and compute the k
w
values for each sub range, as well as for
the full range. If you know the vapor density range for your site, it is
recommended that you select the coefficient, k
w
, that is appropriate for your
site, the dry range or the wet range. If the vapor range for the site is unknown,
or if the vapor range is on the border line between the dry and the wet ranges,
use the value for the full range. Table A-2 shows the final calibration values
A-2