Vaisala Real-time Display Software YOURVIEW User Manual
Page 35
Chapter 7 _________________________________________________________________ Browser
VAISALA _______________________________________________________________________ 33
The graph controls are introduced in Table 4 below.
Table 4
The Graph Controls
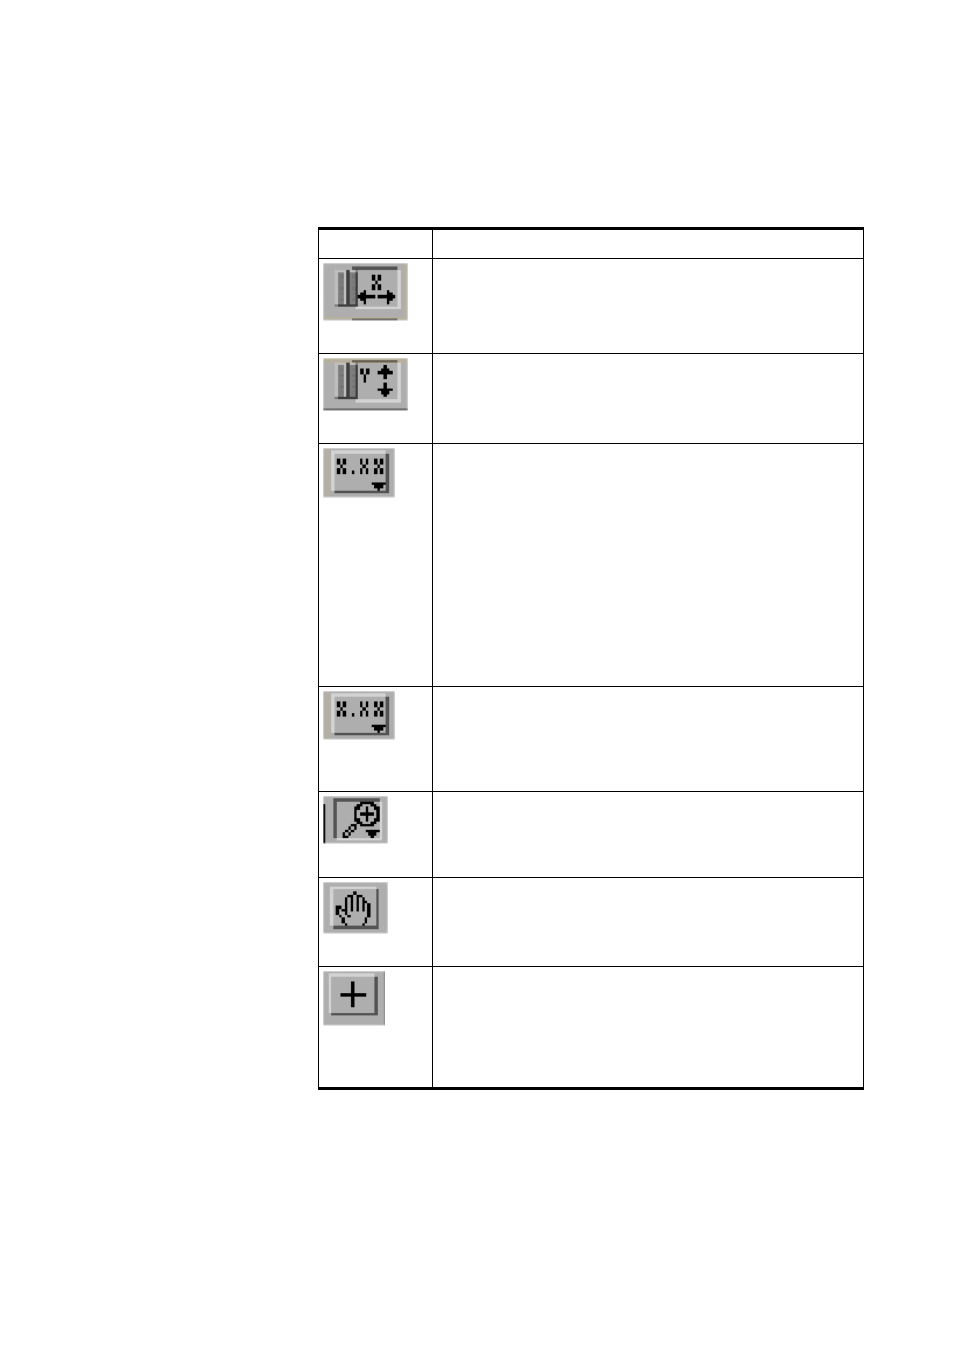
Button Description
X-autoscale
The X-autoscale button is used for scaling the time of the
graph.
Y-autoscale
The Y-autoscale button is used for scaling the Y-data of
the graph and for continuous autoscaling of either scale.
X-scale format
Right-clicking the X-scale format button will open the
Format, Precision, and Mapping Mode buttons.
The Format button is used to format the data on the X-
axis. Valid choices are Decimal, Scientific, Engineering,
Binary, Octal, Hexadecimal, Relative Time, and Absolute
Time.
The Precision button is used to format the data on the X-
axis with the precision selected. Valid choices are 0, 1, 2,
3, 4, 5, and 6.
With Mapping Mode, the valid choices are linear and
logarithmic.
Y-scale format
buttons
Clicking the Y-scale format button will open the actual
format buttons Format, Precision, and Mapping Mode.
They are used as X-scale format buttons apart from the
last three buttons, which control the operation mode for the
graph.
Zoom
Right-clicking the Zoom button will open the zooming tools.
See Table 5 on page 34 for details.
Pan
With the Panning tool you can scroll visible data by
clicking and dragging the sections of the graph.
Cursor
The Cursor can be moved to the left or right, and with the
Lock button also along the interpolated values. When two
or several graphs are displayed simultaneously, the cursor
can be moved from one graph to another (Up and Down
buttons). The locations show the numeric values of the
cursor location shown in Figure 13 on page 34.