Table 2, Example: measured water content 213 ppm – Vaisala MM70 User Manual
Page 58
USER'S GUIDE____________________________________________________________________
NOTE
If the oil sample is very dry and the temperatures are close to each
other, it may cause inaccuracy to the calculation model. In order to
get the best possible performance it is recommended to use oil
conditions that represent real conditions in application.
Recommended values for sample are aw approx. 0.5 at 20 °C.
3.
Define the correlation between aw, T and PPM (w/w) from the
measured values. Calculate A and B according to the following
example.
[ ]
[ ]
( ) ( )
1
/
1
-
2
/
1
1
(
-
2
(
T
T
T
PPM
LOG
T
PPM
LOG
A
sat
sat
)
)
=
[ ]
)
(
A/T1
-
1
T
PPM
LOG
B
sat
=
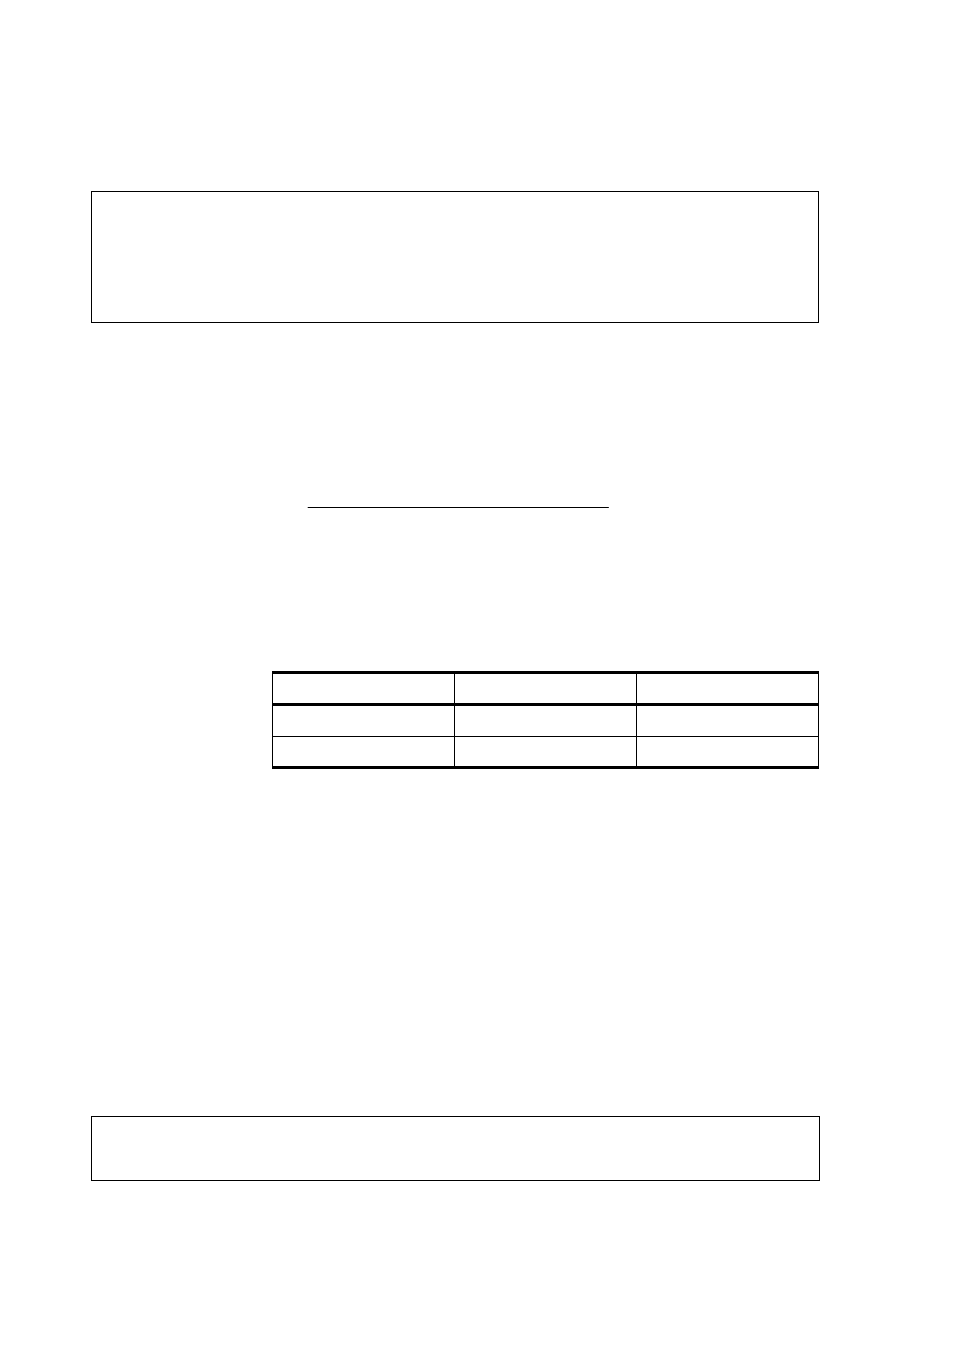
Table 2
Example: Measured Water Content 213 ppm
T (°C)
aw
ppm
saturation
24.1 0.478 213/0.478=445.6067
57.6 0.188 213/0.188=1132.979
A = (LOG(1132.98)-LOG(445.607))/(1/(57.6+273.16)-
1/(24.1+273.16)) = -1189.4581
B= LOG(445.607)-(-1189.4581)/(24.1 + 273.16) = 6.6503583
Assumptions:
The isoterm of water activity versus water concentration is linear and
the solubility curve has the form of the given equation.
NOTE
The sample has to be sealed very carefully i.e. it must not be in
contact with ambient air, which would change the water content.
56 __________________________________________________________________ M210498EN-C