About basic monitoring, Basic monitoring example – HP StorageWorks 16-EL SAN Switch User Manual
Page 164
Performance Monitoring
164
Web Tools Version 3.1.x/4.1.x User Guide
About Basic Monitoring
The Performance Graphs > Basic Monitoring menu provides the following
types of graphs:
■
Port Throughput Graph
■
Switch Aggregate Throughput Graph
■
Blade Aggregate Throughput Graph (Core Switch 2/64 only)
■
Switch Throughput Utilization Graph
■
Port Error Graph
■
Switch Percent Utilization Graph
■
Port SnapShot Error Graph
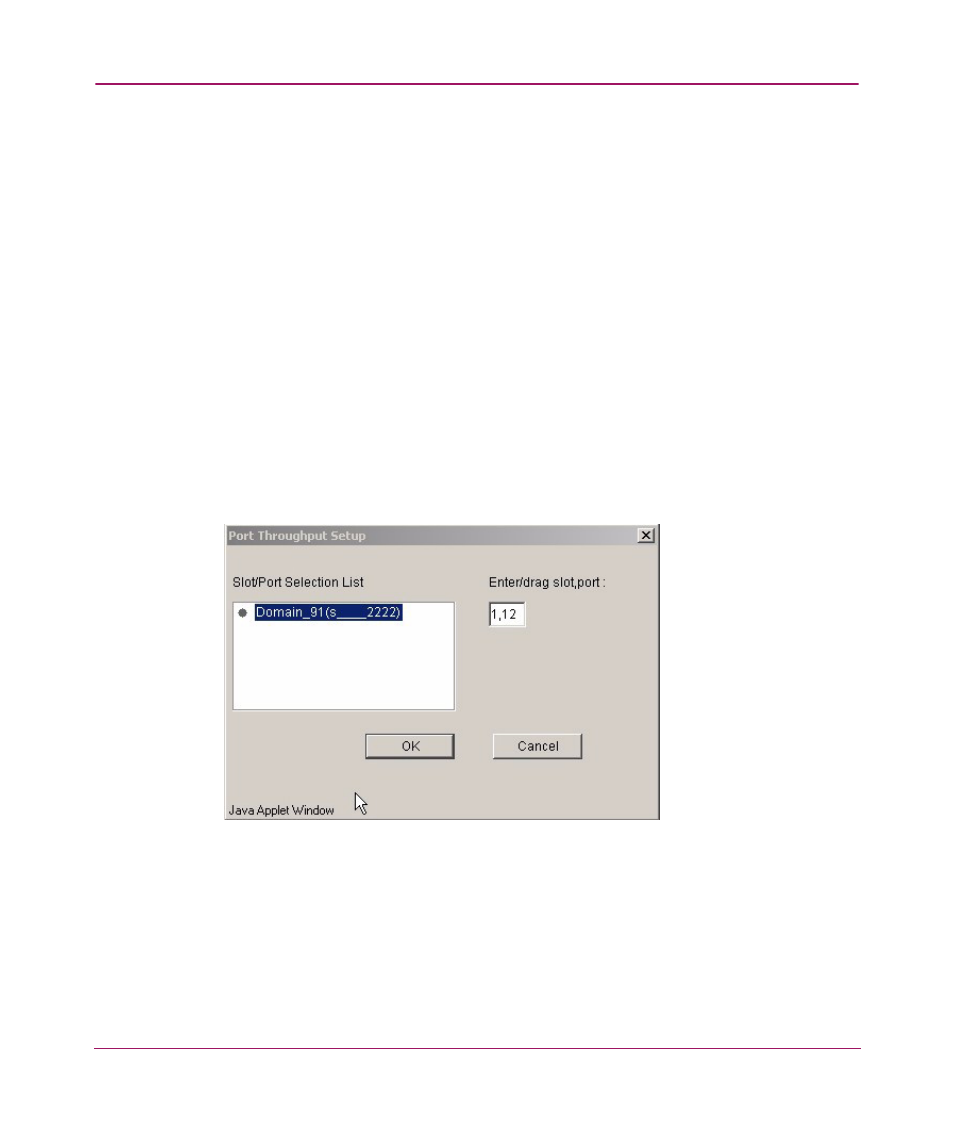
Basic Monitoring Example
An example of a Port Throughput Setup window is shown in
Figure 39: Port Throughput Setup Example on a Core Switch 2/64
This manual is related to the following products: