HP DreamColor LP2480zx Professional Monitor User Manual
Page 46
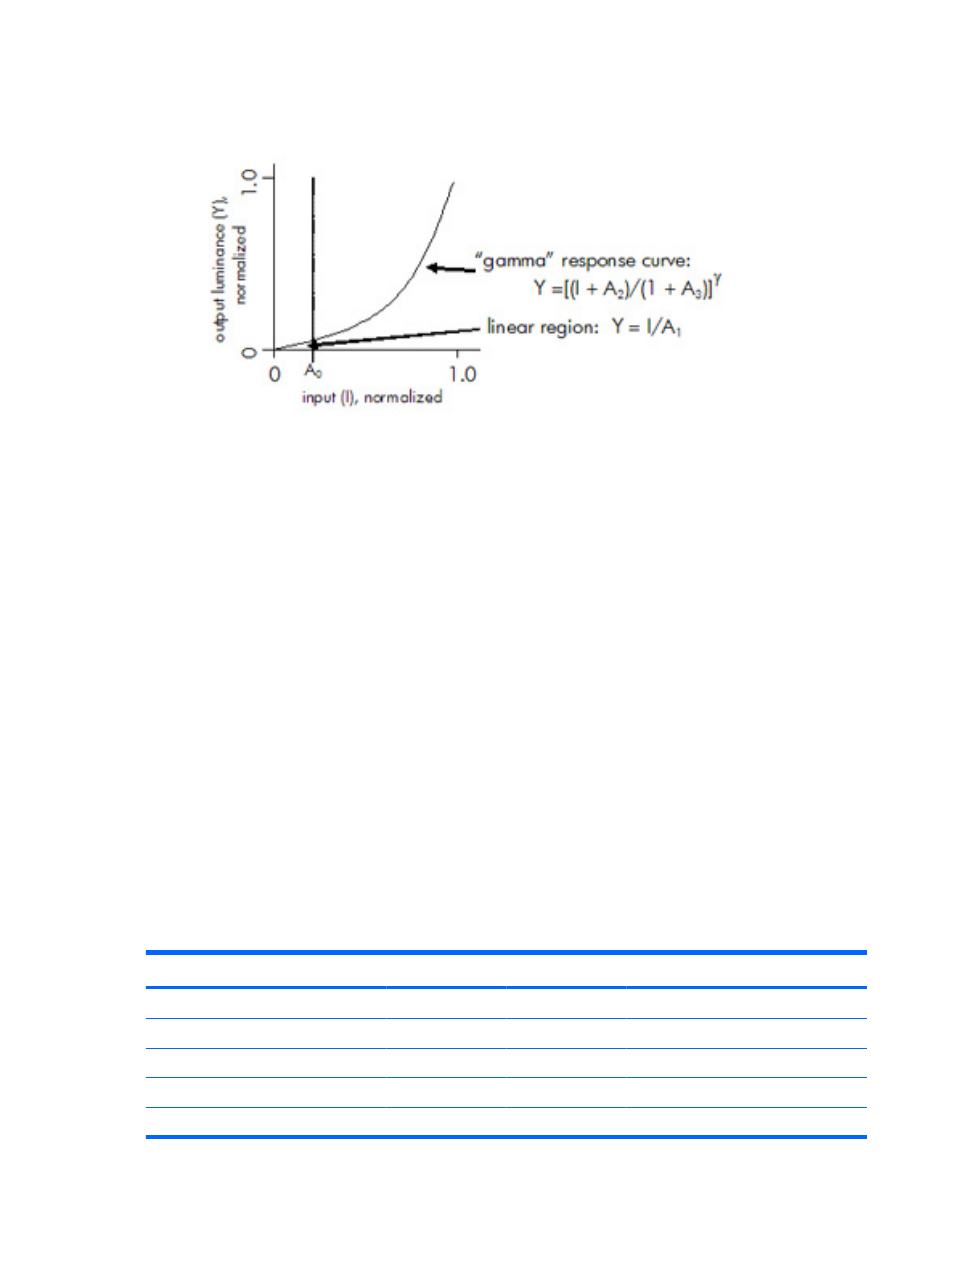
Figure A-7
Low Linear Region Response Curve
A generalized model for the display response curve accommodating the addition of a linear section as
shown above thus requires the specification of four parameters in addition to the “gamma” exponent
value:
For input values (I) ≤ A
0
:
Y = I/A
1
For input values (I) > A
0
′
Y = [(I + A
2
)/(1 + A
3
)]
γ
The response of the LP2480zx is automatically set to the correct standard as part of the color-space
selection, using either the on-screen display (OSD) or using the HP Display Assistant software, or using
the optional HP/X-Rite color calibration tools. Independently programming a custom response (as in the
case of the user-defined custom color space preset) requires use of the HP/X-Rite calibration tools.
Using the software provided with this calibration product, the display response may be programmed
using the four-value-plus-gamma model described above.
Several of the standard color space specifications supported by the LP2480zx require the use of the
“four-value” model, as they include a linear section in the response curve as described above. Of course,
even the simple “gamma-only” model may be accommodated within the four-value model, by setting
the A
0
, A
2
, and A
3
parameters to zero, and A
1
to a value of 1.0. The values used to describe the response
for the standard color spaces or output device specifications supported by the LP2480zx are listed in
the table below.
Table A-3
Response Curve Constants for Various Color Spaces
Color space
A
0
A
1
A
2
A
3
gamma (γ)
sRGB
0.04045
12.92
0.055
0.055
2.4
ITU-R BT.709
0.081
4.50
0.099
0.099
2.22222
SMPTE-C
0.081
4.50
0.099
0.099
2.22222
Adobe® RGB
0
1
0
0
2.19922
DCI-P3
0
1
0
0
2.6
40
Appendix A Advanced Color Management Features and Usage