1 graph display settings – KANOMAX S388-70 Handheld Particle Counter Utility Software Manual User Manual
Page 24
21
7.1 Graph Display Settings
To enter the graph display settings, perform any of the following procedures:
1) Click: [View] →
2) Click:
3) Press the F8 key
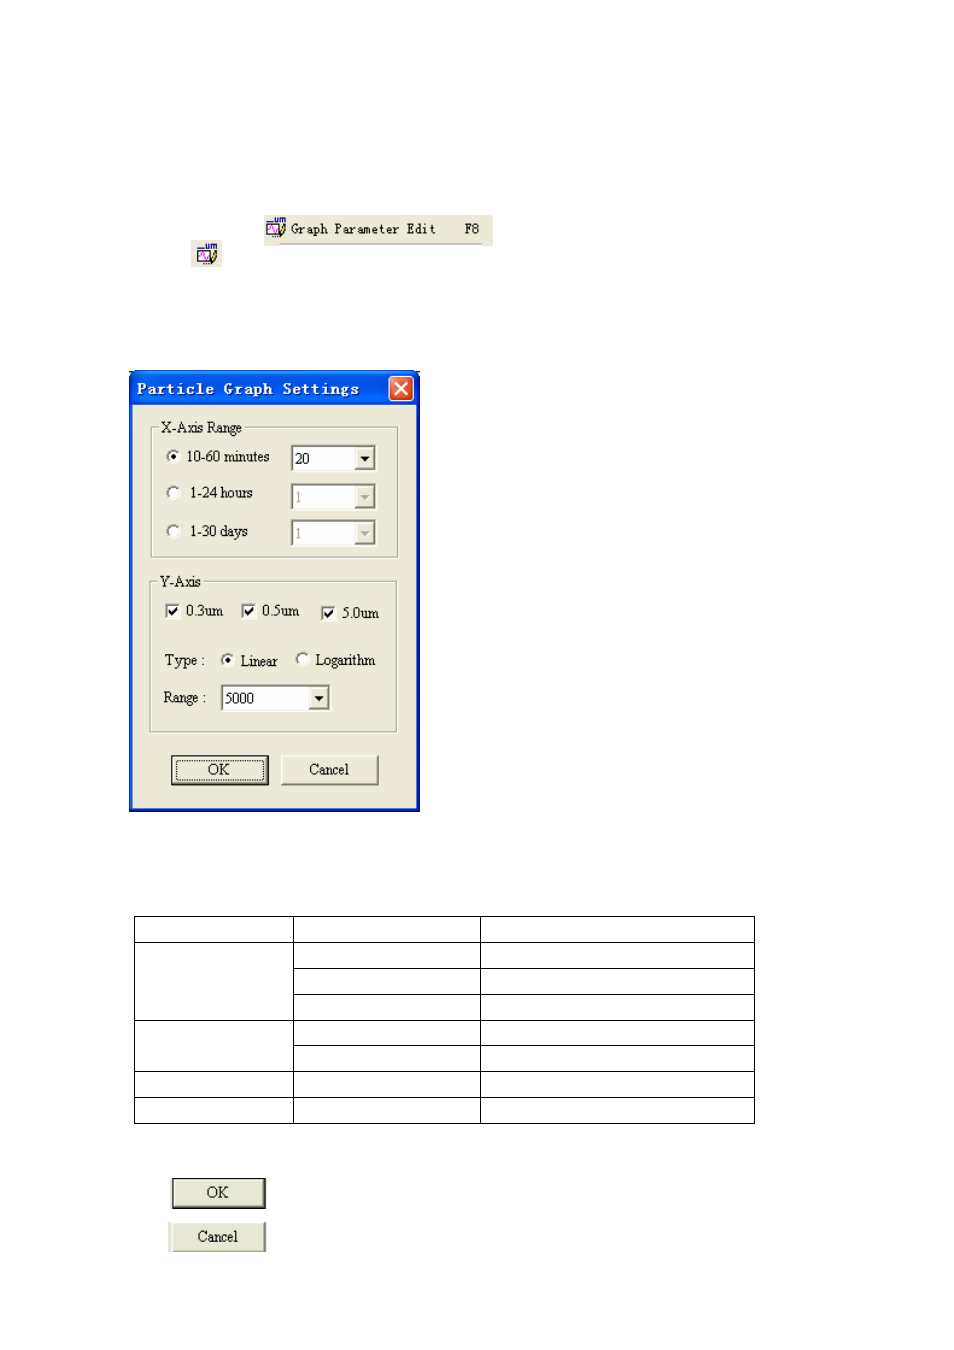
The following Particle Graph Setting dialog box will be displayed.
Fig. 7-2 Particle Graph Setting Dialog Box
1) Parameter Settings
Item Setting
Remarks
Minutes (10 to 60)
10, 20, 30, 40, 50, 60
Hours (1 to 24)
1, 2, 3 …… 24
X-Axis Range
Days (1 to 30)
1, 2, 3, 4…… 30
TYPE-A
0.3µm, 0.5µm, 5.0µm
Particle Size
Display
TYPE-B
0.3µm, 0.5µm, 1.0µm
Scale Type
Linear / Logarithm
Vertical Axis Range Linear / Logarithm
10, 20, 50, 100 …… 1.00E+9
2) Command Button
: To save the input settings, and display the graph according to the settings.
: To exit without saving the input settings.