Vanguard TTRA (ATRT-01, ATRT-03, ATRT-03A, and ATRT-03B) User Manual
Page 29
REV 5 TTRA VERSION 12.x SOFTWARE MANUAL
26
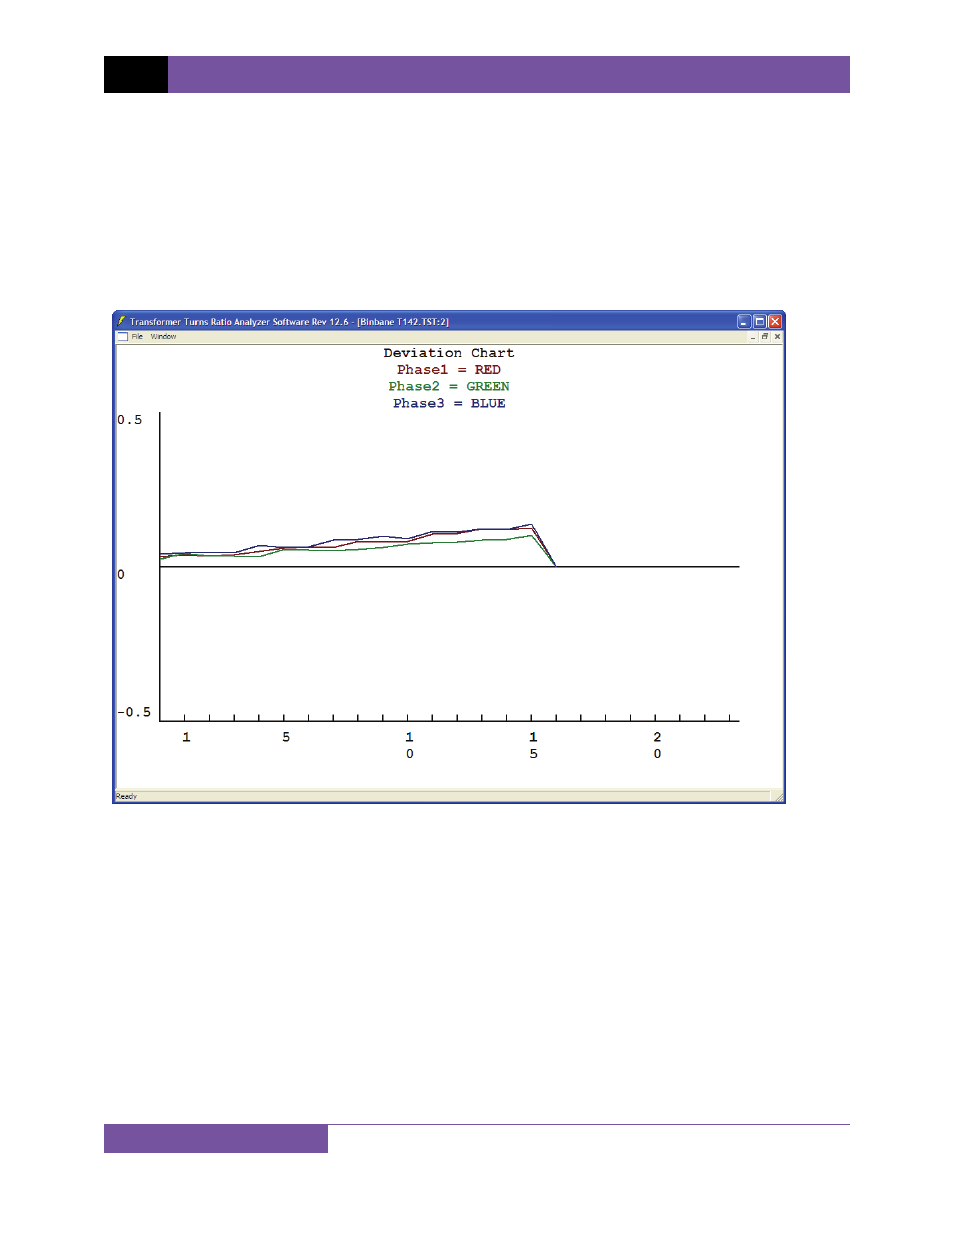
4.8.2. Displaying the Deviation Graph
The deviation graph is a useful tool for analyzing the transformer ratio deviation. The deviation
graph displays the phase A, B, and C turns-ratio deviation of the current test record. The
following formula is used to calculate the deviation, or percent difference:
Deviation = |[(Ratio
calculated
– Ratio
measured
)/ Ratio
calculated
] x 100|
To display the deviation graph for the loaded test record, click on the File menu and then select
the Display Deviation Graph option. A typical deviation graph is shown below in Figure 4.
Figure 4. A Typical Deviation Graph