Teledyne LeCroy Spectrum Analyzer User Manual
Page 5
Instruction Manual
921324 Rev A
3
3. Position the spectrum trace in either of the following ways:
Select Center Span, then enter the Center Freq. and the Freq. Span, the total range of
frequencies that appear on the grid. Use the Up/Down Arrow buttons to quickly step
through the frequency span.
Tip: To change the frequency span in finer increments than the default 1, 2, 5 steps,
check Variable.
OR
Select Start Stop, then enter the absolute Start Freq. and Stop Freq. of the frequency
span.
Tip: Start by viewing a large range of Start Stop frequencies to see where frequencies of
interest occur in the spectrum trace. Then, Center Span around a frequency for a
smaller span.
Note: The spectrum Analyzer always sets the sample rate equal to or higher than twice
the frequency span selected.
The remainder of the steps are optional.
4. Adjust the resolution by unchecking Auto (the default) and entering a new Resolution
BW.
Note: Changing Resolution Bandwidth is equivalent to changing the Timebase to increase
or decrease memory in FFT mode. Reducing the bandwidth will increase the available
memory, enabling a faster update rate, but will decrease the resolution of the trace.
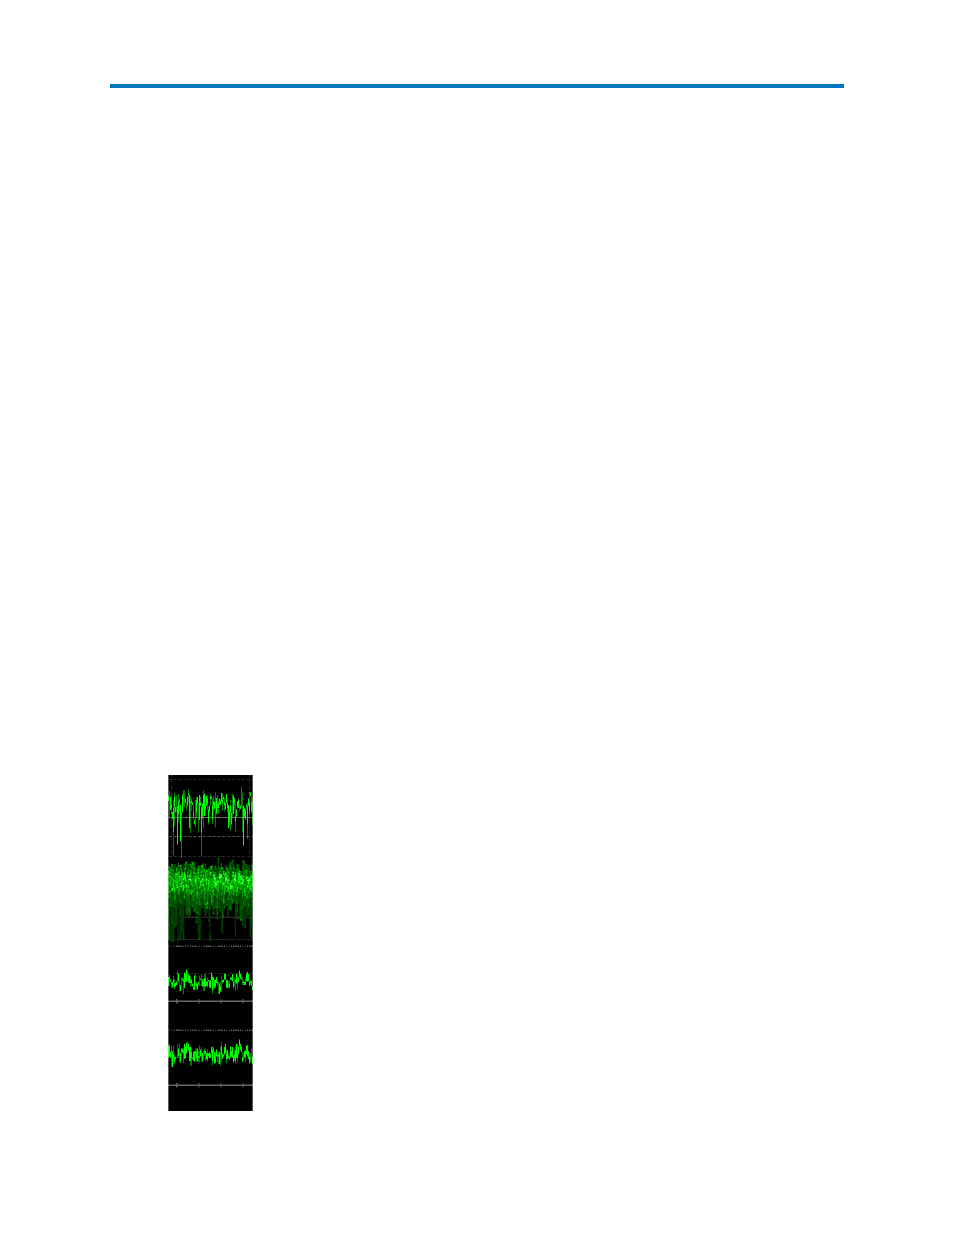
5. Change the operating Mode of the trace:
Normal (default) – displays the power spectrum of the source trace. You
can enable or disable Persistence in this mode.
Persistence
–
in Normal mode with Persistence on, you will see a history of
multiple spectra similar to the display on an RF spectrum analyzer.
Average – choose a number of spectra to average. This effectively reduces
noise and displays more of the harmonic carrier detail.
Max Hold – is useful for swept frequency measurements. It shows the
history of peak values across the frequency axis.