Example, Binning and measurement accuracy – Teledyne LeCroy JTA2 User Manual
Page 29
JTA2-OM-E Rev A
ISSUED: December 2003
27
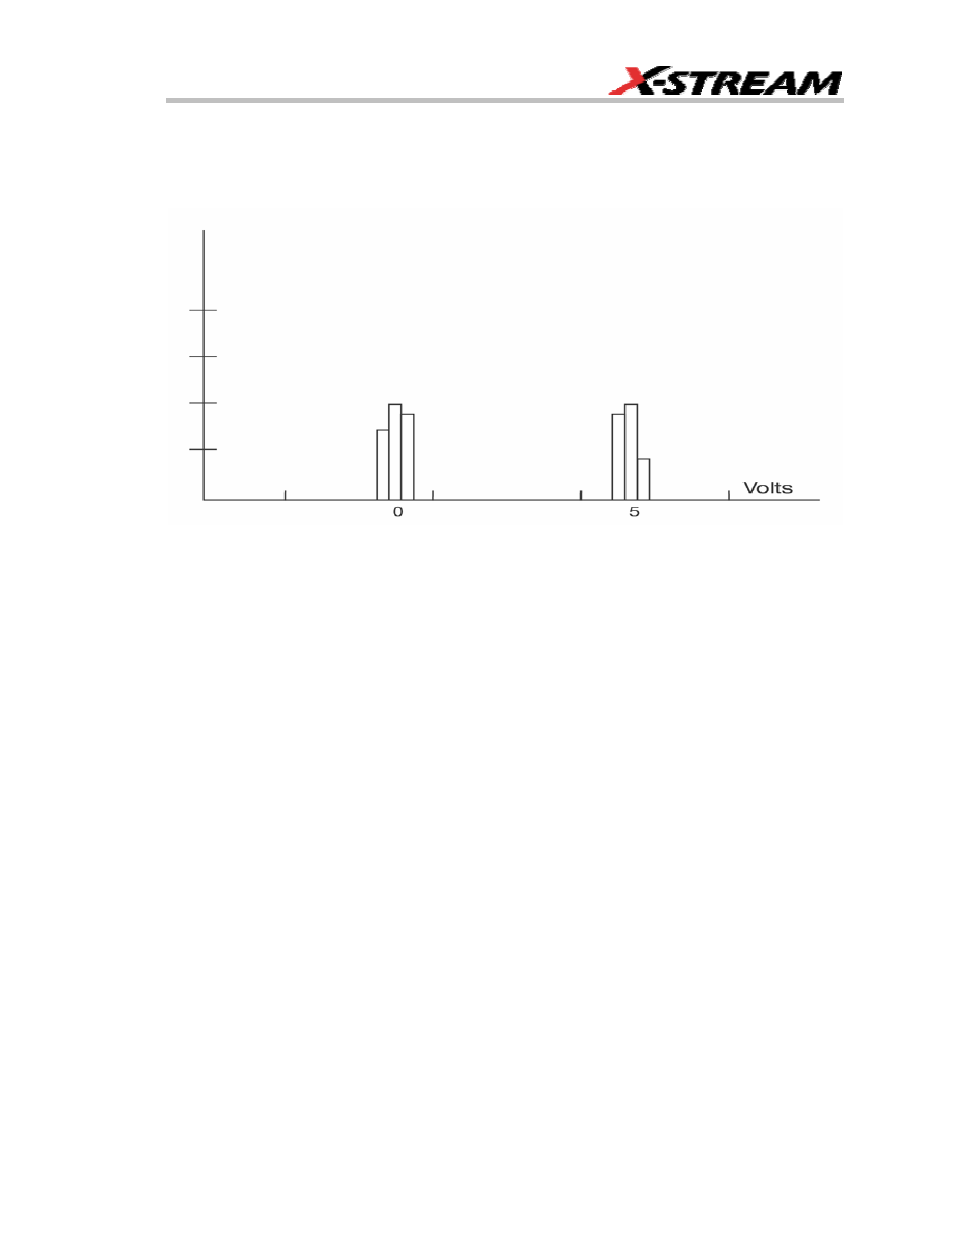
Example
A histogram of the voltage value of a five-volt amplitude square wave is centered on two peak
value bins: 0 V and 5 V (see figure). The adjacent bins signify variation due to noise. The graph of
the centered bins shows both as peaks.
Determining such peaks is very useful because they indicate dominant values of a signal.
However, signal noise and the use of a high number of bins relative to the number of parameter
values acquired can give a jagged and spiky histogram, making meaningful peaks hard to
distinguish. The instrument analyzes histogram data to identify peaks from background noise and
histogram definition artifacts such as small gaps, which are due to very narrow bins.
Binning and Measurement Accuracy
Histogram bins represent a sub-range of waveform parameter values, or events. The events
represented by a bin may have a value anywhere within its sub-range. However, parameter
measurements of the histogram itself, such as average, assume that all events in a bin have a
single value. The instrument uses the center value of each bin’s sub-range in all its calculations.
The greater the number of bins used to subdivide a histogram’s range, the less the potential
deviation between actual event values and those values assumed in histogram parameter
calculations.
Nevertheless, using more bins may require a greater number of waveform parameter
measurements to populate the bins sufficiently for the identification of a characteristic histogram
distribution.
The next figure shows a histogram display of 17,999 parameter measurements divided or
classified into 2000 bins. The standard deviation of the histogram sigma is 6.750 ps.