Xv. typical cooling performance data, Table 8a – Amana PGC(24-60)B User Manual
Page 27
27
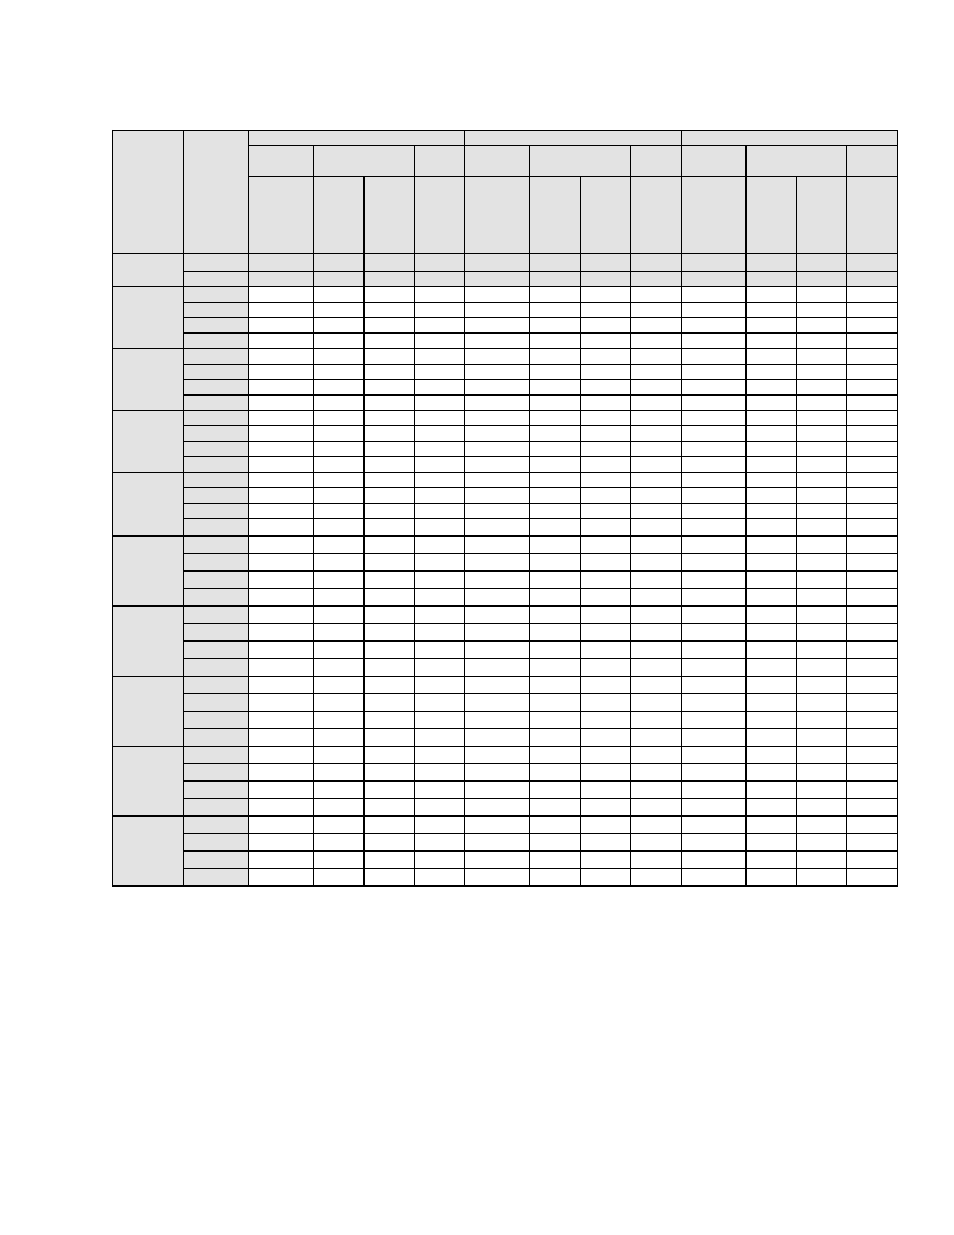
XV. Typical Cooling Performance Data
Outdoor
Indoor
PGC24
PGC30
PGC36
Air Tem p.
at
Air
Tem p.
Indoor
Air Tem p.
Pressure @ Unit
Gauge Fittings
Am ps
Indoor
Air Tem p.
Pressure @ Unit
Gauge Fittings
Am ps
Indoor
Air Tem p.
Pressure @ Unit
Gauge Fittings
Am ps
Condenser
Inlet
(Dry Bulb)
at Evap.
Inlet
(Wet Bulb)
Difference
Betw een
Coil Inlet
and Outlet
Low
Side
High
Side
Total to
Unit
Difference
Betw een
Coil Inlet
and Outlet
Low
Side
High
Side
Total to
Unit
Difference
Betw een
Coil Inlet
and Outlet
Low
Side
High
Side
Total to
Unit
A
B
C
D
E
B
C
D
E
B
C
D
E
° F.
° F.
° F.
PSIG
PSIG
Am ps
° F.
PSIG
PSIG
Am ps
° F.
PSIG
PSIG
Am ps
77
7
92
325
12.8
7
89
320
15.8
7
88
351
19.3
115
72
12
91
324
12.7
12
89
322
15.9
12
87
352
19.4
67
17
91
324
12.7
17
88
322
15.8
17
87
352
19.3
62
23
90
326
12.8
23
87
322
15.8
23
86
352
19.3
77
7
91
308
12.2
7
89
304
15.2
7
87
332
18.5
110
72
12
90
304
12.1
12
88
303
15.1
12
87
332
18.5
67
17
80
304
12.1
17
88
303
15.1
17
86
331
18.4
62
23
89
304
12.1
23
87
302
15.1
23
85
329
18.4
77
7
90
288
11.7
7
88
285
14.5
7
86
311
17.6
105
72
12
90
286
11.6
12
88
285
14.5
12
86
310
17.6
67
18
89
286
11.6
18
87
283
14.5
18
85
312
17.6
62
23
88
286
11.6
23
86
282
14.4
23
84
311
17.6
77
8
89
269
11.1
8
87
267
13.9
8
86
293
16.9
100
72
12
89
269
11.1
12
87
267
13.9
12
85
293
16.9
67
18
89
271
11.2
18
86
267
13.9
18
85
292
16.8
62
23
88
271
11.2
23
85
267
13.9
23
84
290
16.7
77
8
89
255
10.7
8
87
251
13.4
8
85
275
16.2
95
72
13
88
251
10.6
13
86
249
13.3
13
85
274
16.1
67
18
88
252
10.7
18
86
249
13.3
18
84
274
16.1
62
23
87
254
10.7
23
85
249
13.3
23
83
274
16.1
77
8
88
237
10.2
8
86
234
12.9
8
84
255
15.4
90
72
13
88
236
10.2
13
86
232
12.8
13
84
255
15.4
67
18
87
234
10.2
18
86
231
12.8
18
83
256
15.4
62
24
86
235
10.2
24
84
231
12.8
24
83
254
15.4
77
8
87
222
9.8
8
86
217
12.3
8
84
240
14.8
85
72
13
87
221
9.8
13
85
217
12.4
13
83
238
14.8
67
18
86
221
9.8
18
84
216
12.3
18
83
238
14.7
62
24
86
220
9.8
24
83
216
12.3
24
82
239
14.8
77
8
87
203
9.3
8
85
202
11.9
8
83
224
14.3
80
72
13
86
203
9.3
13
84
203
12.0
13
83
223
14.2
67
18
86
205
9.4
18
84
202
11.9
18
82
221
14.2
62
24
85
206
9.4
24
83
202
11.9
24
81
221
14.2
77
8
86
189
9.0
8
84
189
11.6
8
83
208
13.7
75
72
13
86
189
9.0
13
84
189
11.6
13
82
207
13.7
67
19
85
191
9.0
19
83
189
11.6
19
82
207
13.7
62
24
85
190
9.0
24
82
187
11.6
24
81
206
13.6
A Columns - All data based on indoor dry bulb of 80° F and rated air flow. As indoor dry bulb temperature increases, a slight increase will occur in indoor air temperature differential
between inlet and outlet. Low and high side pressures and power will not change.
B Columns - A properly operating unit should be within ±3° F of the typical (dry bulb) value shown.
C Columns - A properly operating unit should be within ±3 PSIG of the typical value shown.
D Columns - A properly operating unit should be within ±7 PSIG of the typical value shown.
E Columns - A properly operating unit should be within ±2 amps of the typical value shown.
Table 8A