Display graph data, Troubleshooting – Velleman WS3080 User Manual
Page 14
WS3080
V. 01 – 21/06/2013
14
©Velleman nv
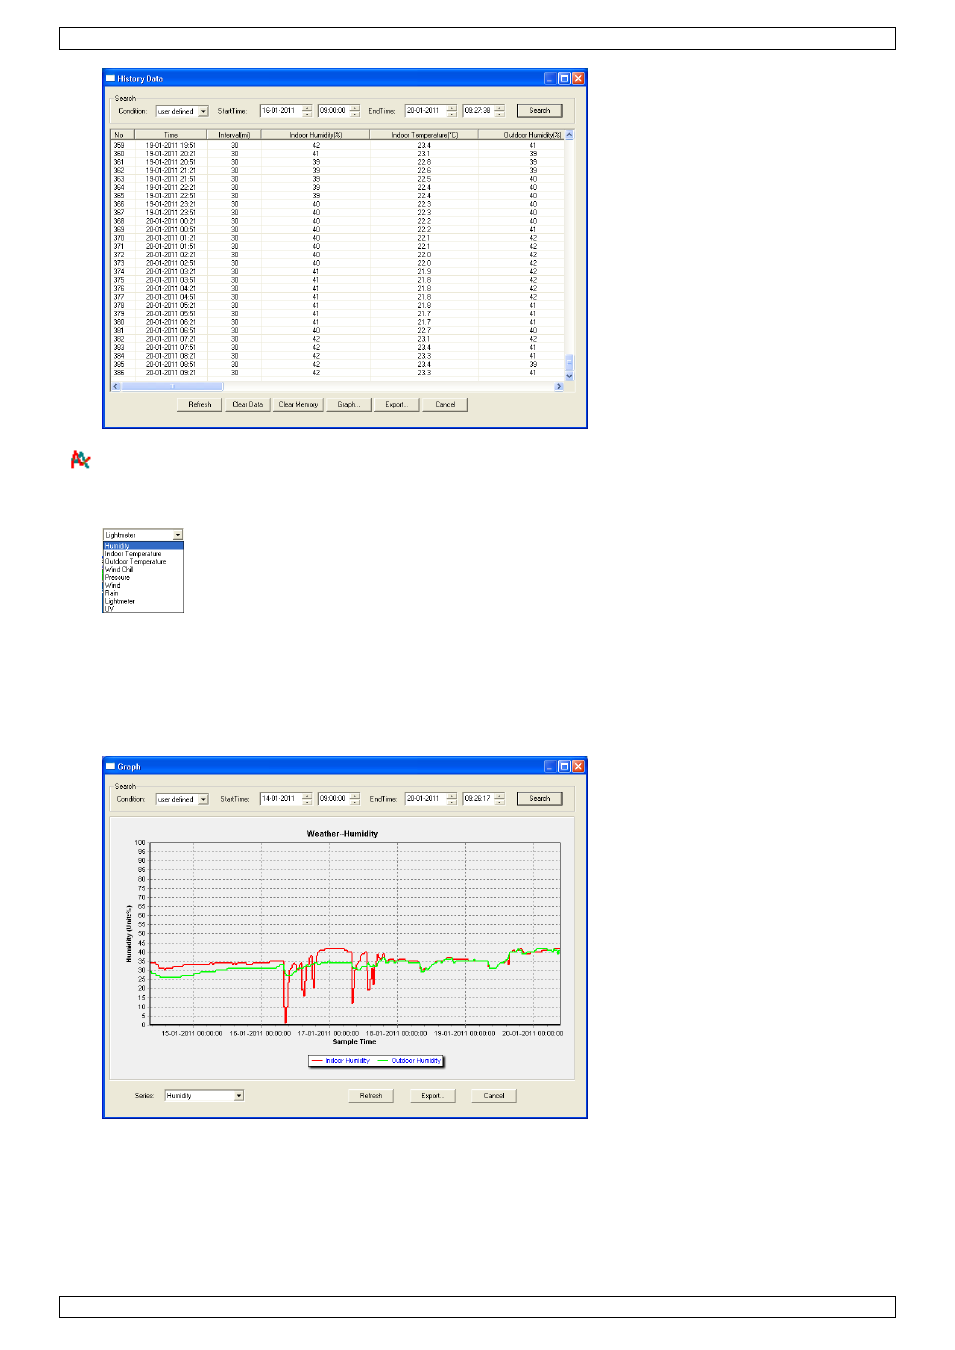
Display graph data
Use this menu to see a graphical representation of the selected data.
1. Select the desired data in the bottom left corner of the display (Series):
2. Set the time interval (condition) in the upper left corner of the display (1 hour, 24 hours, a week, a month
or user defined). When user defined is selected, set the desired start and end time.
3. Click Search (upper right corner) to retrieve the graph.
4. To zoom in on a section of the graph, select the area with the mouse pointer.
5. Click Refresh to update the graph.
6. Press Export to save the graph as a image file (.JPEG format).
Troubleshooting
If the graph function is not working properly, perform following steps:
1. Locate the folder containing ―EasyWeatherPlus.exe‖.
2. Create a text file (using notepad or WordPad) containing following line:
regsvr32 easyweatherplus.ocx
3. Save the file as reg_graph.bat.