Velleman PCSU1000 DSO User Manual
Page 16
PC Oscilloscope PCSU1000
15
© 2005 ... Velleman
·
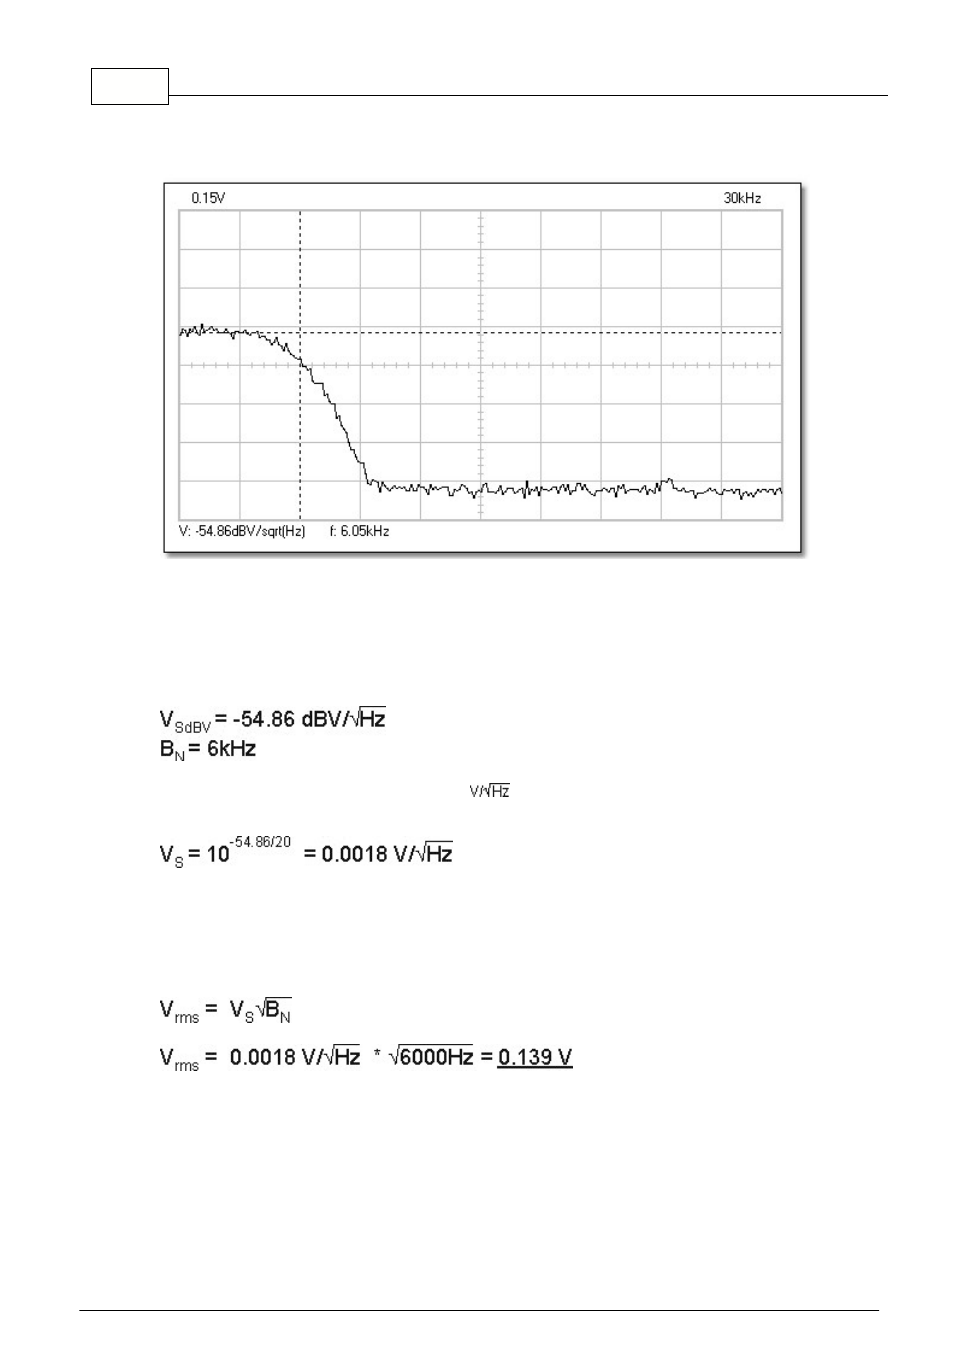
View / Markers (FFT) f & Spectral Density dBV/sqrt(Hz)
This image shows the spectrum of the band limited noise signal.
The analysis of noise in the frequency domain shows the distribution of the noise amplitude as a
function of frequency.
Using the Spectral Density marker and the Frequency marker, the voltage spectral density (VSdBV)
and the noise bandwidth (BN) can be read from the spectrum analyzer display.
First convert the voltage spectral density to
.
This can be accomplished using the following calculation:
This is the magnitude of the spectrum normalized to a 1 Hz bandwidth.
You may calculate the noise voltage over any bandwidth by multiplying this value by the square root of
the bandwidth.
Assuming a 6 kHz bandwidth, the total output noise voltage is:
(See the V
rms
value of the oscilloscope waveform image of this noise signal.)