Velleman PCSU1000 DSO User Manual
Page 14
PC Oscilloscope PCSU1000
13
© 2005 ... Velleman
Waveform Parameters
Software automatically calculates various voltage and time parameters of a signal, such as DC
mean, amplitude, rise time etc.
These parameters are displayed in a separate window. Use the check boxes in the window to
select the parameters you which to be displayed.
Markers
Displays Markers on the screen.
Bright Grid
Brightens the signal grid on the screen.
Dot Join
On: The dots of the acquired waveform data are connected by lines.
Off: Only the dots of the acquired waveform data are displayed.
Markers in ocilloscope mode
·
Two horizontal markers for measuring voltage. The voltage difference and the absolute voltage
values (in parentheses) are displayed.
·
Two vertical markers for measuring time and frequency
Note: The voltage markers give preference to channel CH1 if both channels are being used.
Markers in spectrum analyzer mode
·
Marker function for absolute and relative voltage measurement is provided.
·
The absolute voltage level in dBV or the voltage difference in decibels (dB) can be measured.
·
Noise level can be measured using the
marker.
·
One vertical marker is provided for the frequency measurement.
Moving the markers
1.
Place the mouse pointer over a dashed marker line.
2.
Press and hold the left mouse button. The markerline turns solid.
3.
Drag the marker to the appropriate position
dB
The term dB or decibel is a relative unit of measurement used to describe power or voltage
difference.
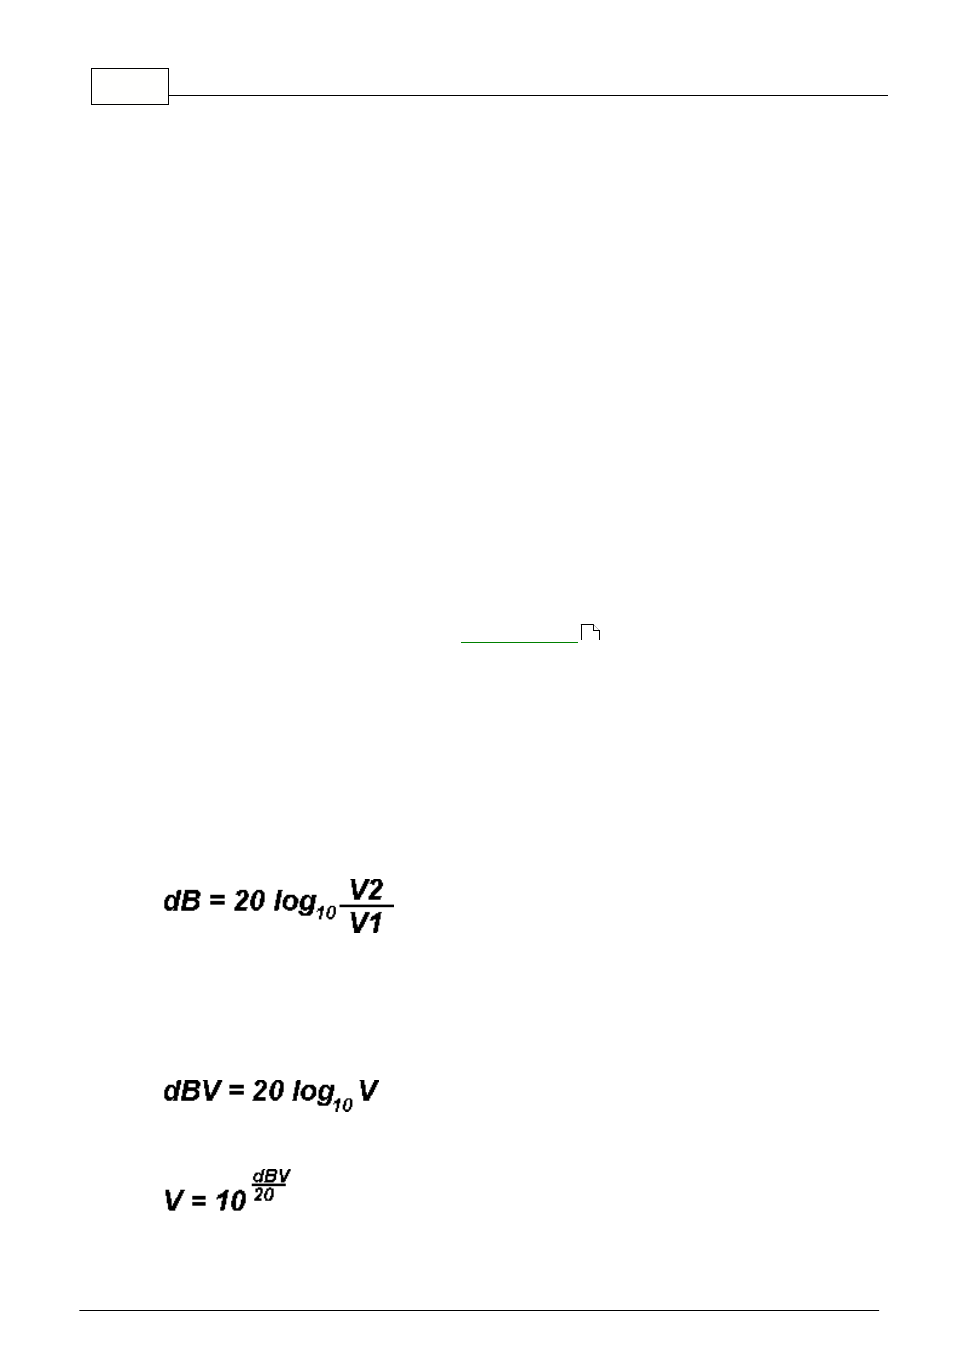
Equation to calculate a dB value based on the ratio of two voltages V2 and V1 is:
dBV
dBV = The dB value is obtained with respect to 1Volt. The dBV is an absolute unit of voltage. It
expresses voltages as a ratio relative to 1 volt.
Equation to calculate a dBV value of a voltage V is:
Equation to calculate voltage V from dBV value is:
14