Typical characteristics table of graphs – Texas Instruments TPA3003D2 User Manual
Page 8
TPA3003D2
SLOS406A − FEBRUARY 2003 − REVISED MARCH 2003
8
www.ti.com
TYPICAL CHARACTERISTICS
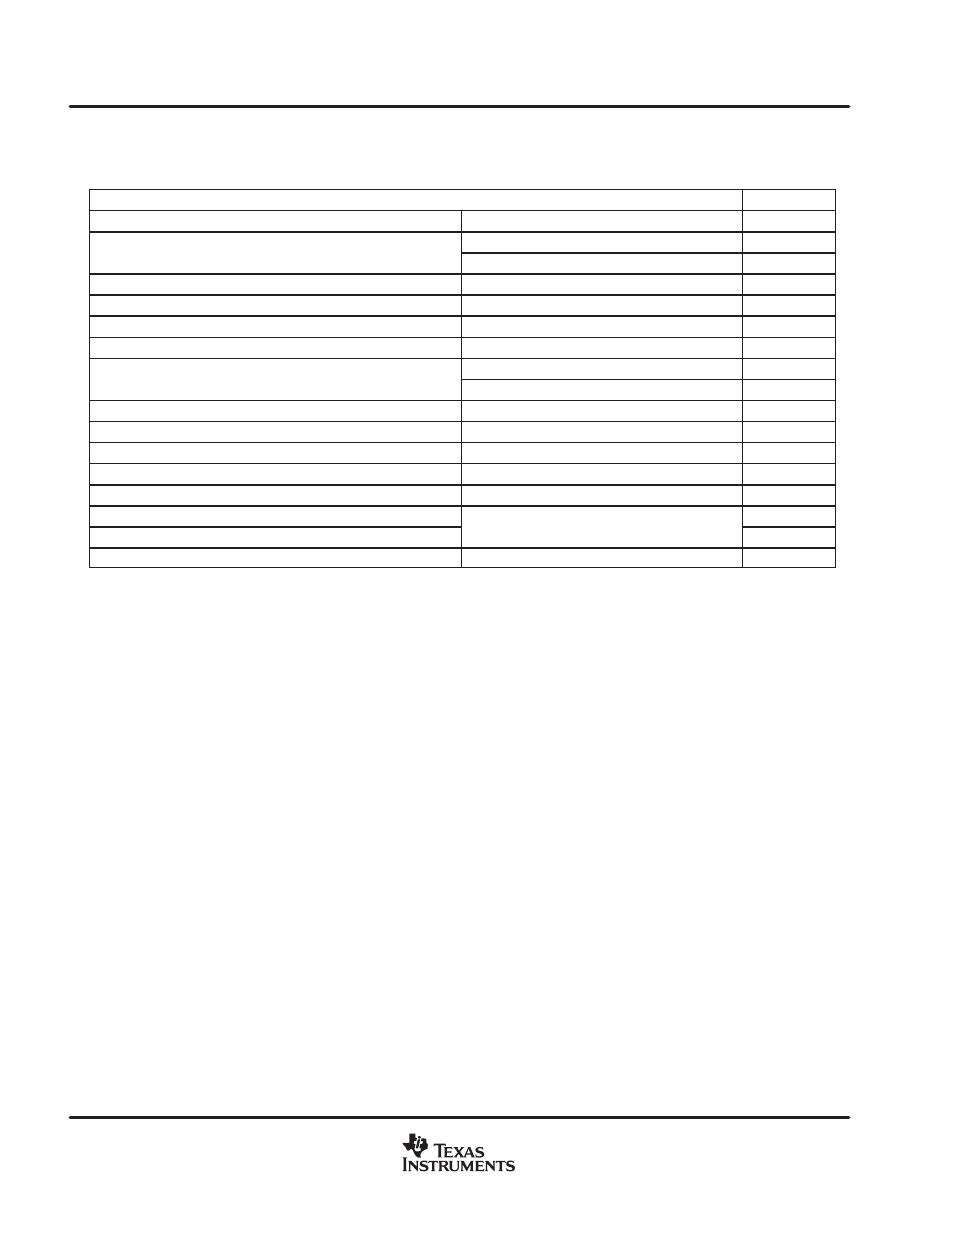
Table of Graphs
FIGURE
Efficiency
vs Output power
1
PO
Output power
vs Load resistance
2
PO
Output power
vs Supply voltage
3
IQ
Quiescent supply current
vs Supply voltage
4
ICC
Supply current
vs Output Power
5
IQ(sd)
Quiescent shutdown supply current
vs Supply voltage
6
Input impedance
vs Gain
7
THD+N
Total harmonic distortion + noise
vs Frequency
8, 9
THD+N
Total harmonic distortion + noise
vs Output power
10, 11
kSVR
Supply ripple rejection ratio
vs Frequency
12
Closed loop response
13, 14
Intermodulation performance
15
Input offset voltage
vs Common-mode input voltage
16
Crosstalk
vs Frequency
17
Mute attenuation
vs Frequency
18
Shutdown attenuation
vs Frequency
19
Common-mode rejection ratio
vs Frequency
20
- THS4151 (26 pages)
- TRF1500 (74 pages)
- SLOU082 (28 pages)
- TAS5508-5121K8EVM (24 pages)
- TPA6102A2 (16 pages)
- TPA3001D1EVM (22 pages)
- TPA6030A4 (25 pages)
- TPA701 (26 pages)
- TPA6110A2 MSOP (18 pages)
- TAS5727 (21 pages)
- THS4503EVM (28 pages)
- TPA005D02 (50 pages)
- SLOU121 (42 pages)
- TPA0243 (20 pages)
- TPA0253 (20 pages)
- TPA102 MSOP (26 pages)
- THS4131 (26 pages)
- SLOU020A (28 pages)
- TPA751 MSOP (20 pages)
- TPA005D12 (44 pages)
- TPA6139A2 EVM (8 pages)
- TPA0103 (32 pages)
- SLOU106 (26 pages)
- THS4141 (26 pages)
- THS3001 (20 pages)
- TPA0233 (20 pages)
- TPA2008D2 (26 pages)
- 2004 (20 pages)
- SLAU081 (44 pages)
- TPA301 (28 pages)
- TPA3100D2 (11 pages)
- SLOU023A (26 pages)
- TAS5110D6REF (45 pages)
- TA5704EVM (27 pages)
- TAS5518 (20 pages)
- APA100 (42 pages)
- TPA3200D1 (30 pages)
- TAS5066PAG (22 pages)
- TPA6204A1 (16 pages)
- THS4150 (26 pages)
- TPA311 (28 pages)
- TPA3008D2 (31 pages)
- TPA6101A2 (16 pages)