Hha as se e, Eea as su ur re em me en nt ts s – Sound Performance Lab Parametric Equalizer User Manual
Page 22
22
OPTIMIZER
The following measurements show that the Optimizer´s
phase response is very stable at high amplitudes.
The doted line in fig. 16 illustrates the frequency response
from 0Hz to 200kHz for two combined equalizers (band 1 and
2). The solid line shows the phase reponse with only 2° diver-
tion at 20kHz!
A broad frequency range has become a major demand for
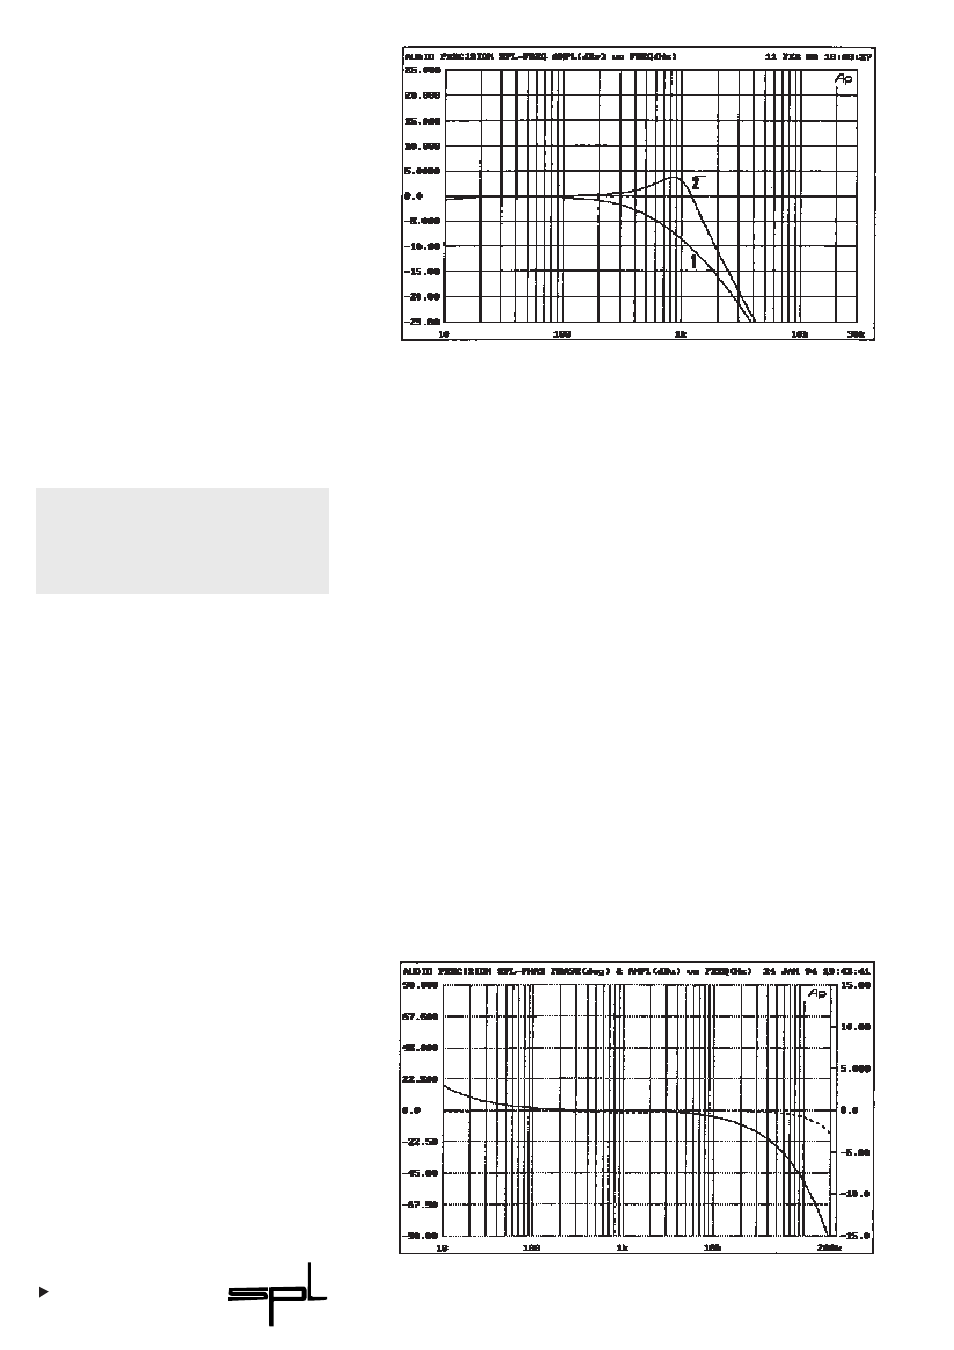
Fig. 15:
Curve 1:
Low-pass, Q = 1,5;
Roll-Off = gentle
Curve 2:
Low-pass; Q = 1,5;
Roll-Off = steep
Fig. 16:
Doted line :
Frequency response
Solid line :
Phase response
Measurements at Q = 1.0;
Frequency = 1kHz; Boost/Cut
= 0dB;
Frequency range:
34-7100Hz
P
P
H
HA
AS
SE
E
M
M
E
EA
AS
SU
UR
RE
EM
ME
EN
NT
TS
S