Display – Fluke 574 User Manual
Page 23
23
574
Display
C
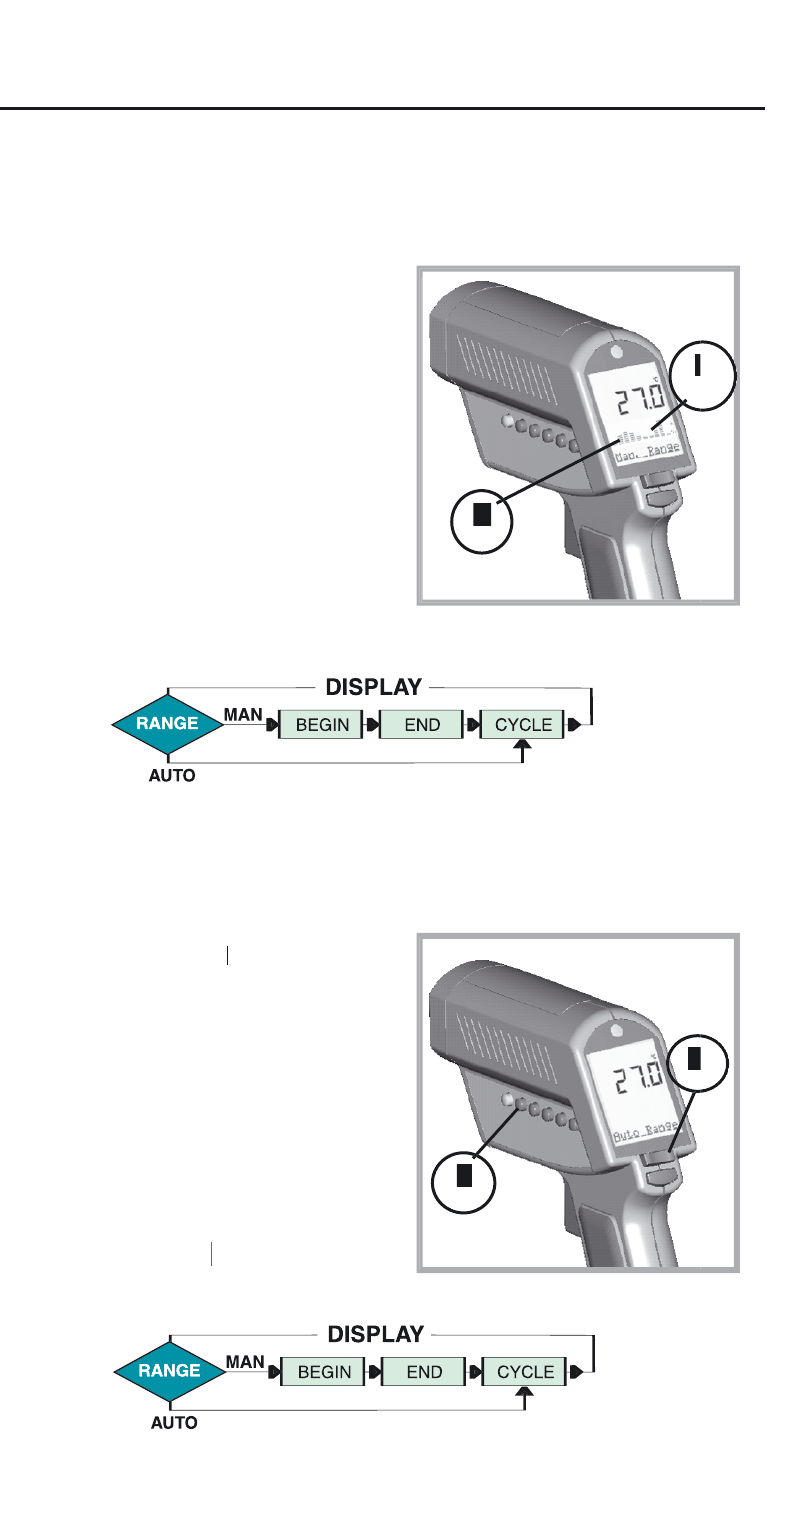
The graphic display (4)
shows the temperature as
a picture. The last ten
measurements are shown
(B). It is possible to choose
between Auto Range and
Manual Range. In manual
range the user defines the
beginning and ending
temperature points of the
graph.
4
Press DISPLAY
Press DISPLA
Press DISPLA (L) once.
Use the Up and Down
keys (C) to toggle between
ranges. Auto Range is
automatically defined by
the measured maximum
and minimum value.
Manual Range (Man
Range) is user defined
(see DISPLAY, BEGIN
(see DISPLA
(see DISPLA
section).
GRAPHIC DISPLAY
AUTO OR MAN RANGE
See also other documents in the category Fluke Thermometers:
- 117 (20 pages)
- 117 (26 pages)
- 576 (4 pages)
- STIK 1552A EX (22 pages)
- 1552A EX (22 pages)
- ESA612 (78 pages)
- FoodPro Plus Food Safety Thermometer (22 pages)
- 561R (2 pages)
- 50D (12 pages)
- 50S (14 pages)
- PN 3612805 (22 pages)
- 56X (34 pages)
- THE HART 1529 (150 pages)
- 561s (16 pages)
- 5623A (17 pages)
- 66 (12 pages)
- 561 (22 pages)
- PN 4060712 (20 pages)
- 900 (182 pages)
- 53IIB (26 pages)
- 1529 Chub-E4 (154 pages)
- 80T-150UA (6 pages)
- 9105 (65 pages)
- 1594A (130 pages)
- 1522 (60 pages)
- Thermometer 576 (33 pages)
- 07-402 (10 pages)
- 233 (16 pages)
- 80T-150U (1 page)
- HART SCIENTIFIC 1502A (43 pages)
- 572 (22 pages)
- SERIES II 51 (12 pages)
- 5626/5628 (22 pages)
- 2180A (116 pages)
- TYPE K 80PK-3A (4 pages)
- 1523 (36 pages)