Quick start, Leq-pc – Ivie LEQ-PC -- Companion for Analysis on PC User Manual
Page 4
LEQ-PC
Quick Start
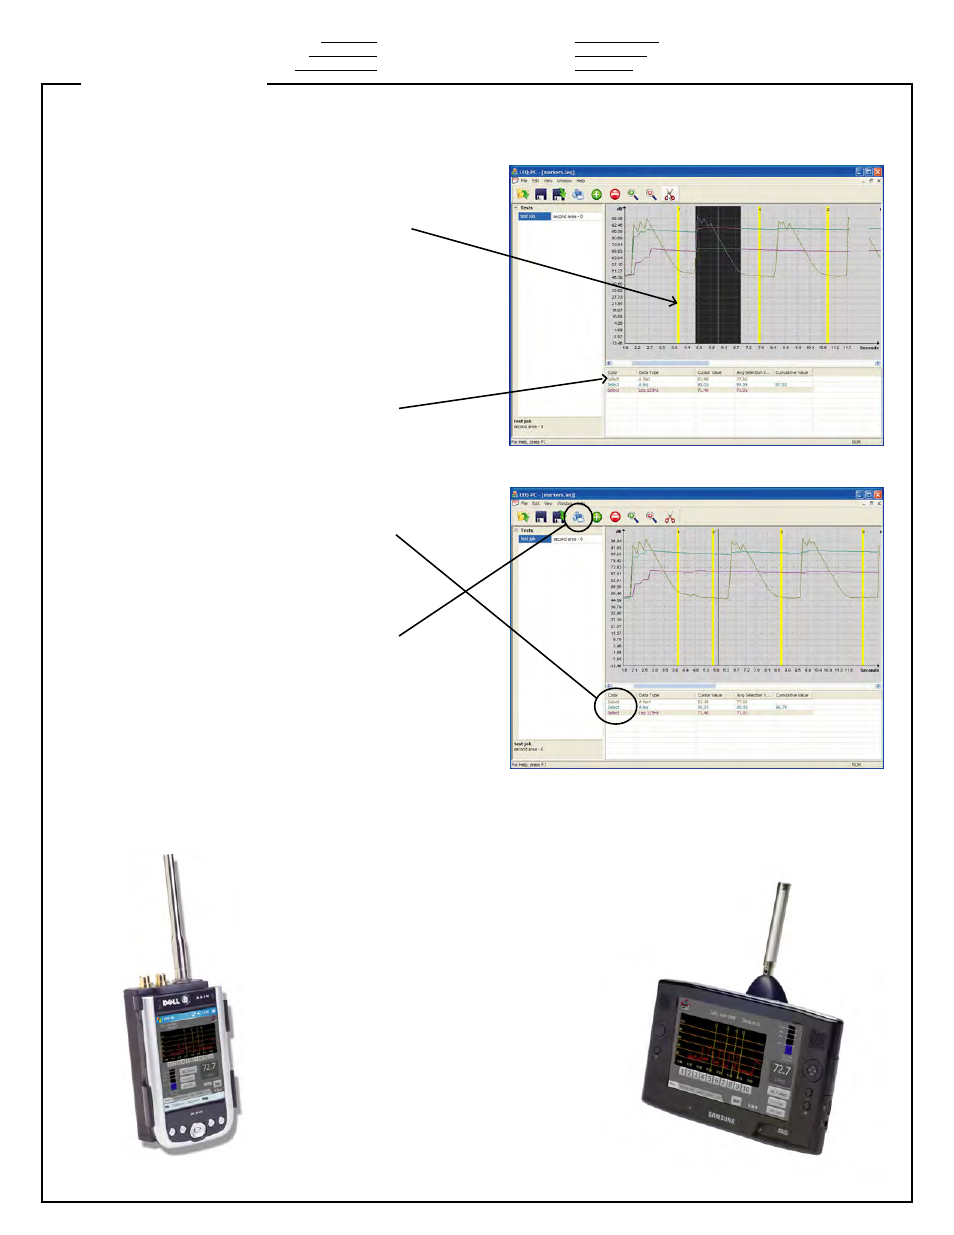
If you have used event markers in the
original LEQ measurements on the IE-35
or IE-45 survey instruments, they will be
shown in the LEQ-PC chart window.
These can also be removed by the same
process.
The data window shows each data-type
you have selected to display. Individual
columns on each data line show the color
select for text and graph for that data line,
the data type, cursor value, average
selection value, and cumulative value (for
pertinent data).
To change the color of the data text on a
data line (the corresponding line on the
chart) simply right-click anywhere on a
data line in the data window. Select the
desired color and then click on "ok".
When the desired selection of data and
chart material is completed, a print-out of
the chart can be done by selecting the
print function in the tool bar. Normal
Windows printing conventions are
followed. The data graphs in the chart
window will be printed, along with the
corresponding data lines from the data
window (space permitting).
Ivie Technologies
1605 N West State St.
Lehi, UT 84043
801.766.7600
www.ivie.com