Quick start, Leq-pc – Ivie LEQ-PC -- Companion for Analysis on PC User Manual
Page 3
LEQ-PC
Quick Start
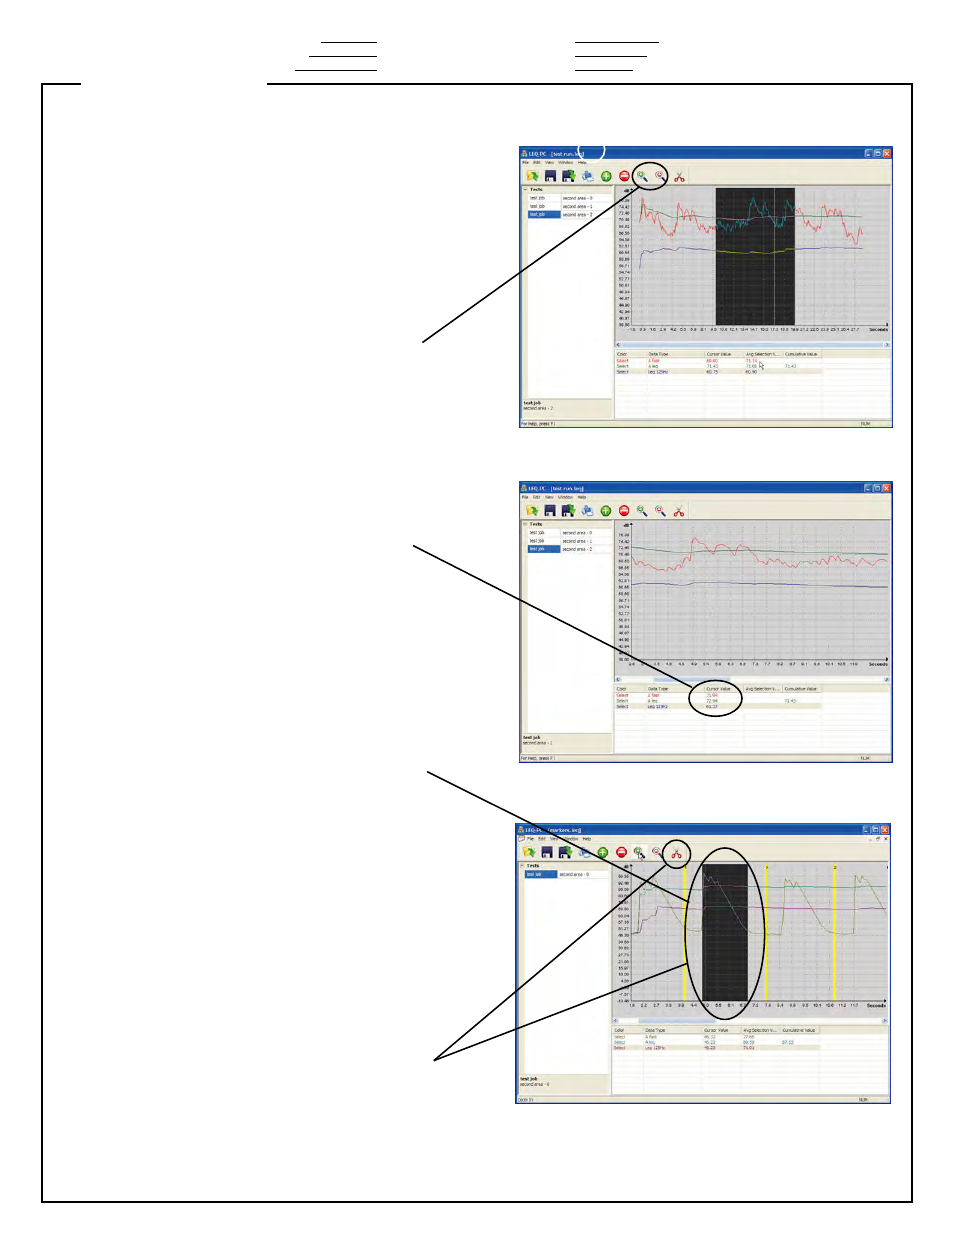
The chart window shows a graphic
representation of the data selected in the
data window. The chart window
automatically re-scales the amplitude and
time axis depending on the data to be
displayed. For longer measurements a
scroll bar at the bottom of the chart window
allows moving to the desired time/area of
the data.
The Zoom In/Out functions allow you to
zoom the chart window to view data in higher
resolution. The "+" and "-" magnification
icons in the tool bar allow easy zooming.
The cursor line in the chart window has
several functions. As you fly your mouse
cursor over the chart window you will see
that the cursor value window on each data
line show the actual value for the type of
data selected for that point along the chart.
The curso line is also used for editing data
and for creating an area of data from which
average values can be displayed.
A time-area of specific interest may be
selected and the average values for that
area will be shown in the "Avg. Selection
Value" window. Simply click and drag the
mouse cursor over the desired area on the
chart. You will find tha average values for
the area selected are immediately shown in
the avg. selection value column of the data
lines.
Sometimes it is necessary or desireable
to remove some data from the chart. The
user may wish to exclude unexpected noises
from the LEQ measurement. To remove
unwanted areas from the LEQ measurement,
zoom in to view the unwanted area in detail,
then click and drag the cursor to cover that
area (much in the same way as selecting
data for averages). Then click on the remove
"scissors" icon in the tool bar. The area will
be removed from the chart and LEQ values
will be recalculated to reflect the new LEQ
and other values.